Econ 203 Project - Mapping data using shapefiles
Importing the data from an Excel file
Set up your working directory and download this data. After that, install all the packages and use the function read.xlsx() to import the Excel file.
setwd("C:/Users/marce/Desktop/Econ 203 RP")

## If you don't have those packages, start with
## libs<-c("tigris","xlsx","stargazer","GISTools","spdep","rgdal", "sp","ggplot2","maps", "viridis", "readr" ,"dplyr", "gridExtra", "ggthemes", "dlnm", "ggmap", "tmap")
## lapply(libs, install.packages, character.only = TRUE)


libs<-c("tigris","xlsx","stargazer","GISTools","spdep","rgdal", "sp","ggplot2","maps", "viridis", "readr" ,"dplyr", "gridExtra", "ggthemes", "dlnm", "ggmap", "tmap")
lapply(libs, require, character.only = TRUE)

crime<-read.xlsx("CrimeOneYearofData.xlsx", sheetName = "Data", head=T, as.data.frame = T)

View(crime)
Importing the shapefile
Download the shapefile of US states here. Put all files together with the Excel data in your working directory.
ogrListLayers("states.shp")
us_states<-readOGR("states.shp",layer="states")
View(us_states@data)
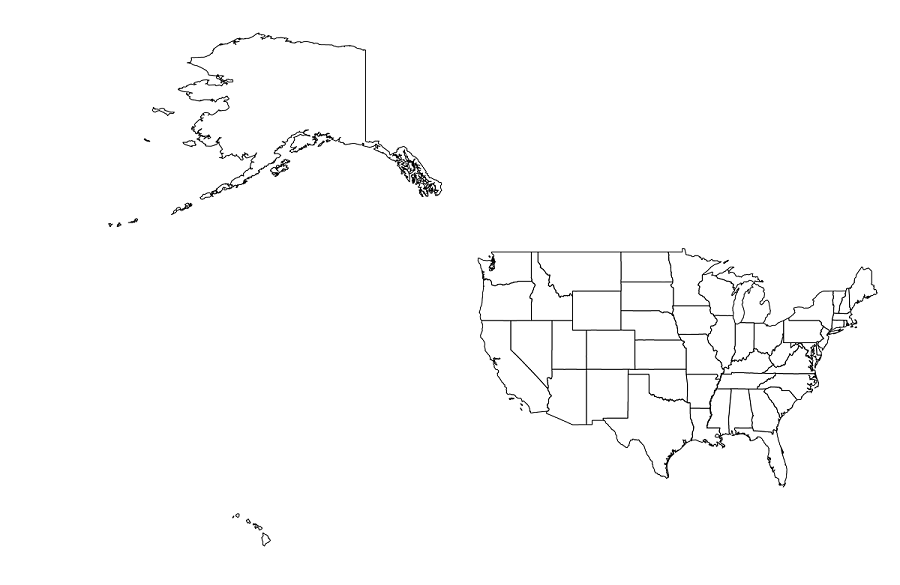
plot(us_states)
Merging shapefile and dataset
names(crime)[1]<-"STATE_NAME"

crime_us_states<-geo_join(us_states, crime, by="STATE_NAME")

View(crime_us_states@data)
Plot the map using tmap
tmap_mode("view")

tm_shape(crime_us_states)+tm_borders(lwd = 2, col = "white", alpha = .4) +
  tm_polygons("Murder_rate",  style="quantile", palette="YlGnBu",alpha=0.7, title="Homicide Rate")+
  tm_legend(legend.position = c("left", "bottom"))