Econ 203 Project - Working with Line Plots
Importing the data from an Excel file
First step is to set up your working directory. Also, to run this exercise, you will need to download this file and install the following packages: xlsx, ggplot2 and ggthemes.
setwd("C:/Users/marce/Desktop/Econ 203 RP")

## If you don't have those packages, start with
## libs <- c("xlsx","ggplot2", "ggthemes")
## lapply(libs, install.packages, character.only = TRUE)

libs <- c("xlsx","ggplot2", "ggthemes")
lapply(libs, require, character.only = TRUE)


## This is the monthly civilian unemployment data (%), seasonally adjusted

un_usa<-read.xlsx("UN_USA.xlsx", sheetName = "Sheet1", head=T, as.data.frame = T)
View(un_usa)
Line plot with dates
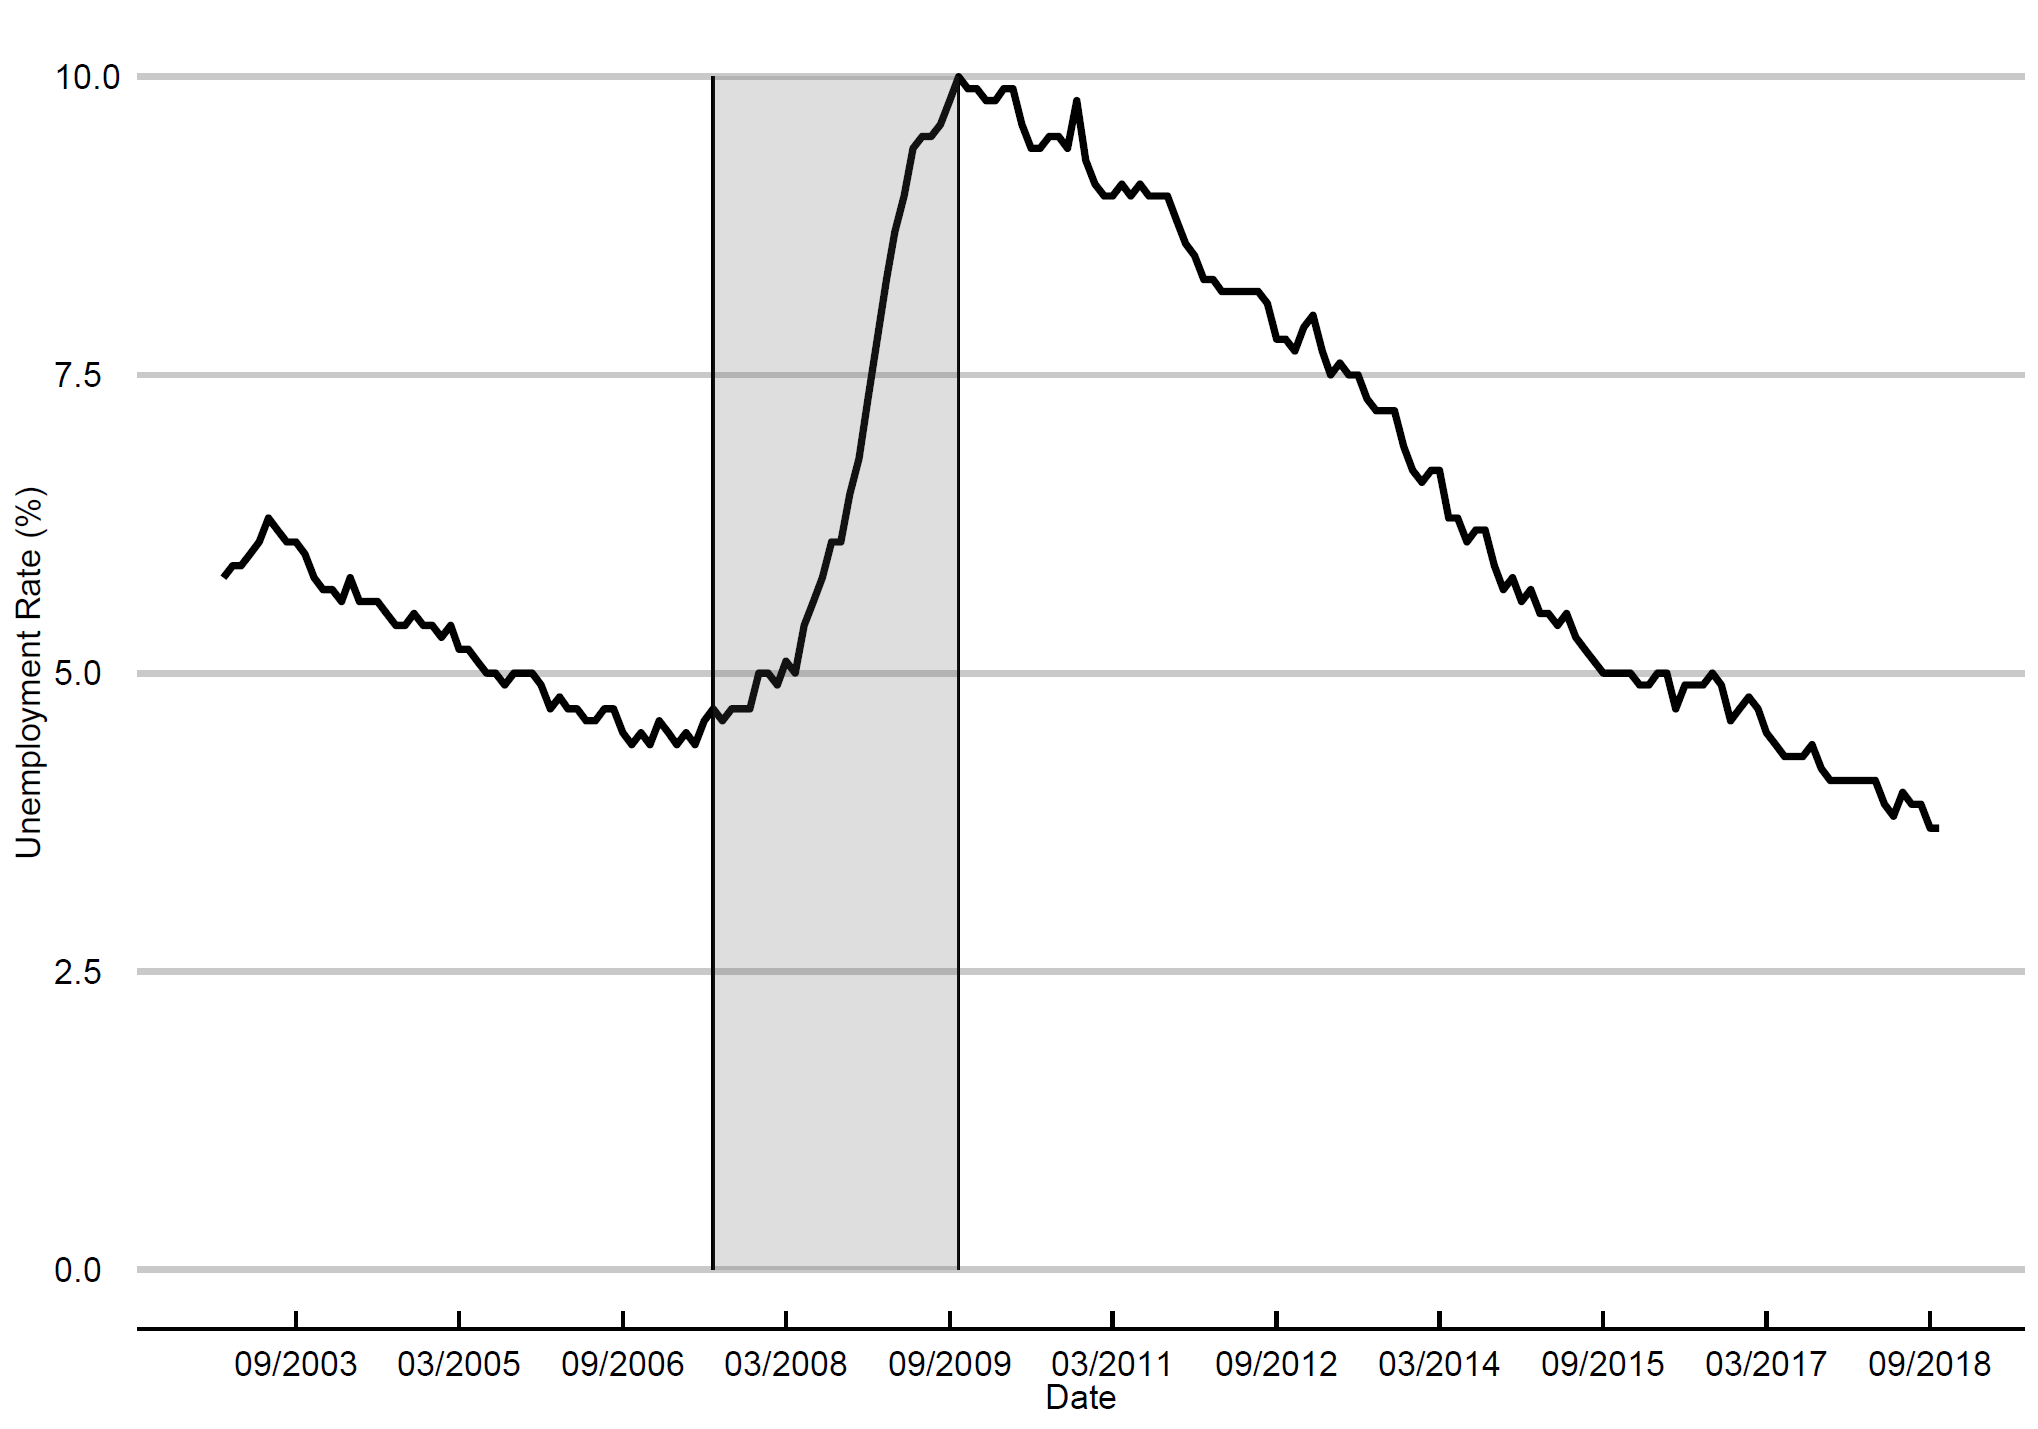
The data start in January 2003 and end in October 2018. Breaking the dates into 18 months window, you get a cleaner x-axis (you may try different values for that). I am highlighting the data between July 2007, when the subprime crisis started, and October 2009, when the unemployment had its peak in this sample: 10%. To do that, I use geom_segment function for the black vertical lines and annotate() for the gray shaded area.
p1<-ggplot(data = un_usa, aes(x = date, y = UNRATE))+
  geom_line(size = 1.4) + labs(x = "Date", y="Unemployment Rate (%)")+
  theme_economist_white(base_size = 14, gray_bg = FALSE) + scale_colour_economist()  +
  scale_x_date(date_breaks = "18 months", date_labels = "%m/%Y")+
  geom_segment(aes(x=as.Date("2007-07-01"),xend=as.Date("2007-07-01"), y=0 ,yend=10))+
  geom_segment(aes(x=as.Date("2009-10-01"),xend=as.Date("2009-10-01"), y=0 ,yend=10))+
  annotate("rect", xmin = as.Date("2007-07-01"), xmax = as.Date("2009-10-01"), ymin = 0, ymax = 10,
           alpha = .2)

p1
That’s what you get when you run the code: