Three Essays on Crime Prevention
March, 2023
The Areninhas Project
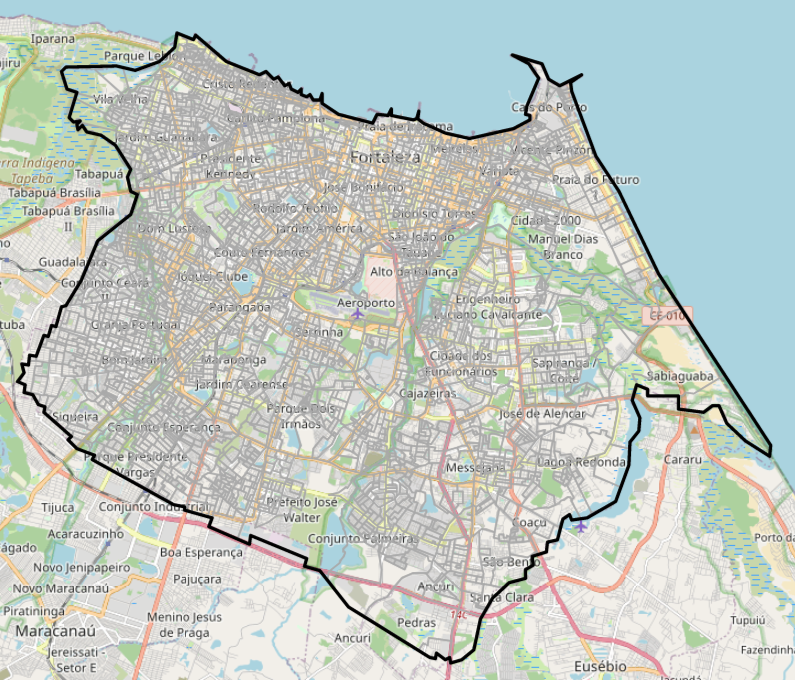
Fortaleza is the fifth largest Brazilian city and is the state capital of Ceará, located in the Northeast region of the country
The city has 120.6 sq mi of territorial area and population around 2.7 million - similar to Houston and Chicago
- From 2010 to 2020, Fortaleza’s population grew by 10%
Census 2010 divides the city into 3,043 census tracts - a.k.a neighborhoods - and 3,020 are populated
- An average tract has 812 people in 0.105 sq km
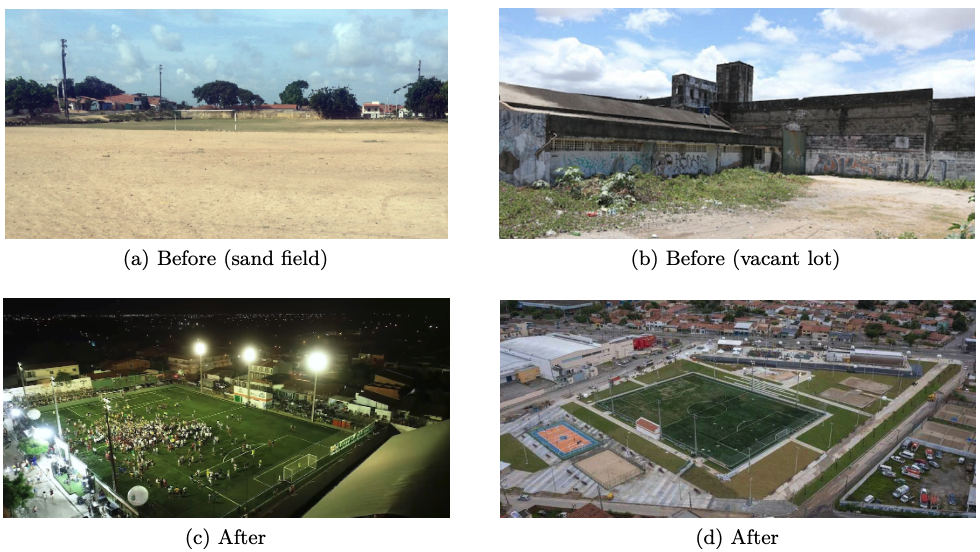
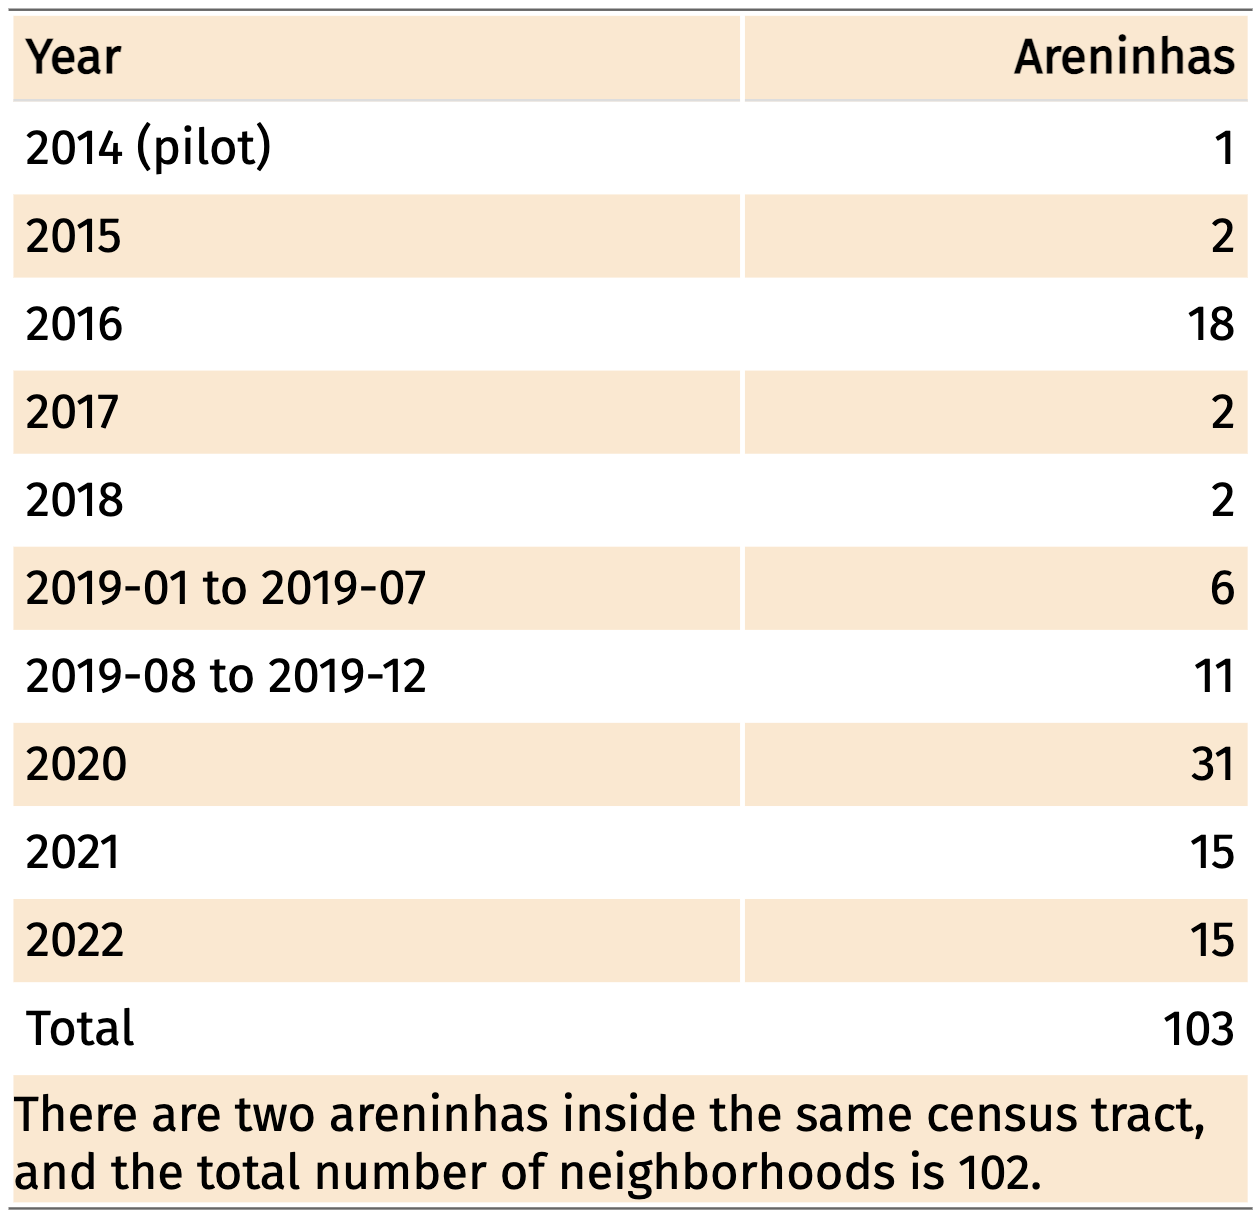
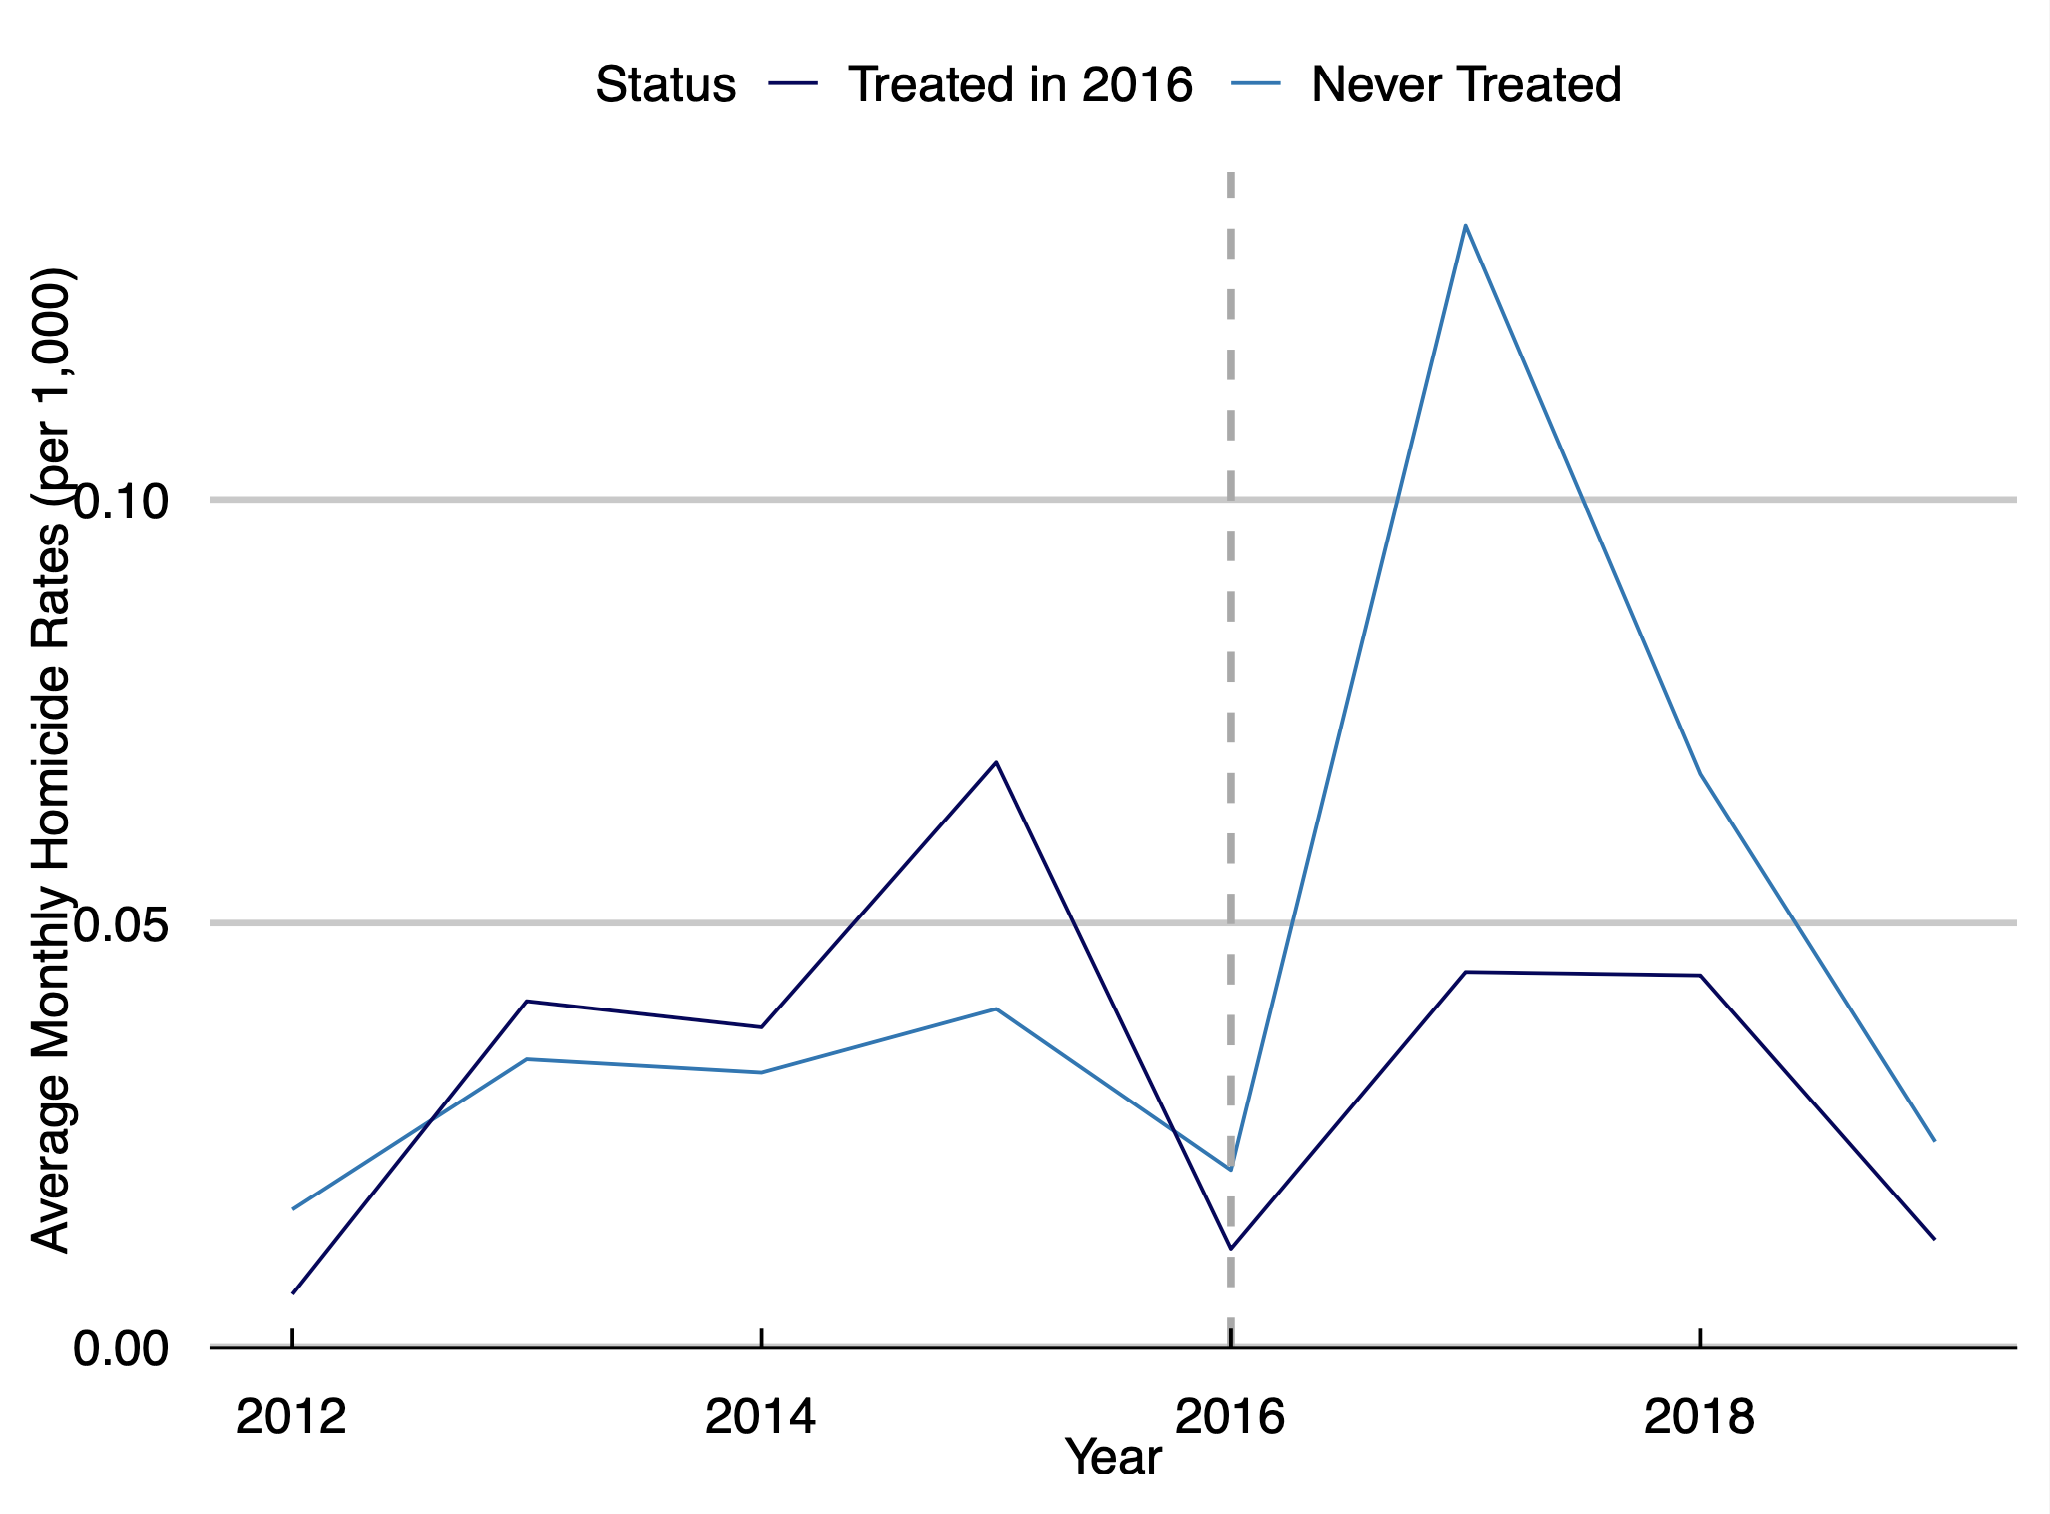
In July 2014, The City of Fortaleza began an ongoing urban renewal project called “Areninhas”
The intervention consists of synthetic football turf, a playground and an outdoor gym. The surroundings are improved with further infrastructure development
The project targets vulnerable communities and aims to provide an amenity that promotes physical activity and stimulates a sense of community
In 8 years, 103 football arenas were built in Fortaleza and more than 160 in the rest of the State
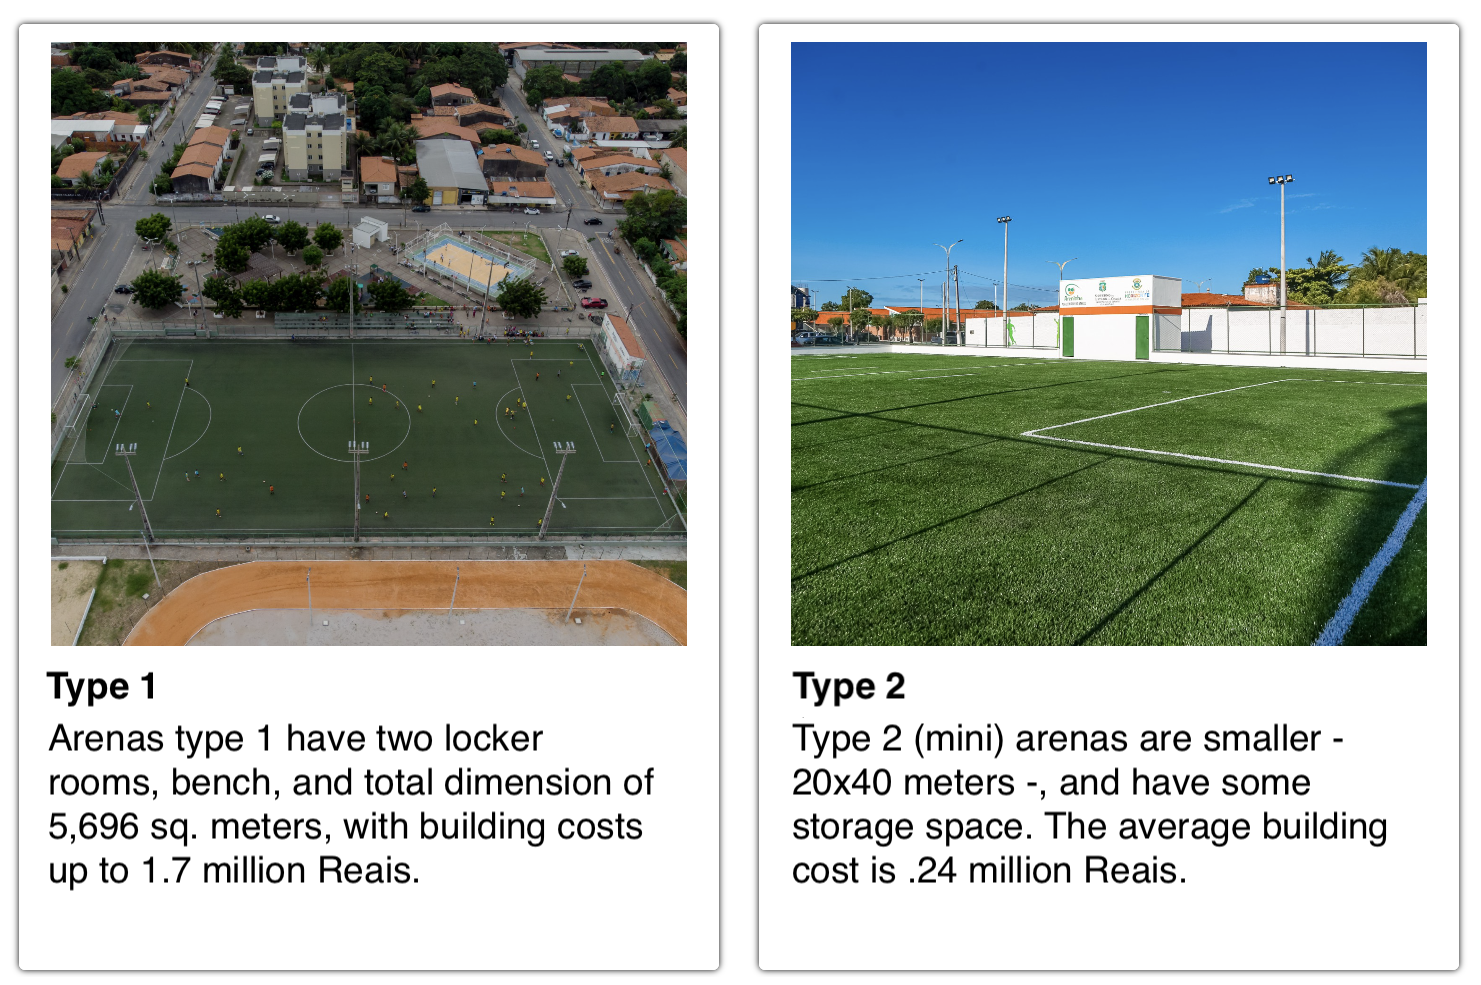
There are two types of equipment - Areninhas type 1 and 2. They differ by the size of the turf field and presence of locker rooms and bench
Each equipment have three employees. Two guards (one in the morning, one in the evening) control access to the fields, and one janitor cleans and organizes the place.
According to the City Hall, maintenance costs (salaries, energy and water) range from R$ 120,000 to 125,000/year.
Currently, 102 neighborhoods have an equipment - around 94,000 people covered
City Hall and State Government invest R$ 24.87 millions/year in four social projects: Esporte em 3 tempos, Futpaz, Esporte superação, and Atleta Cidadão
Projects directly impacts around 32,000 children
Amateur football championships are held on weekends, dance/fitness classes occur regularly, and pick-up football games happen at daily basis

Data and Context
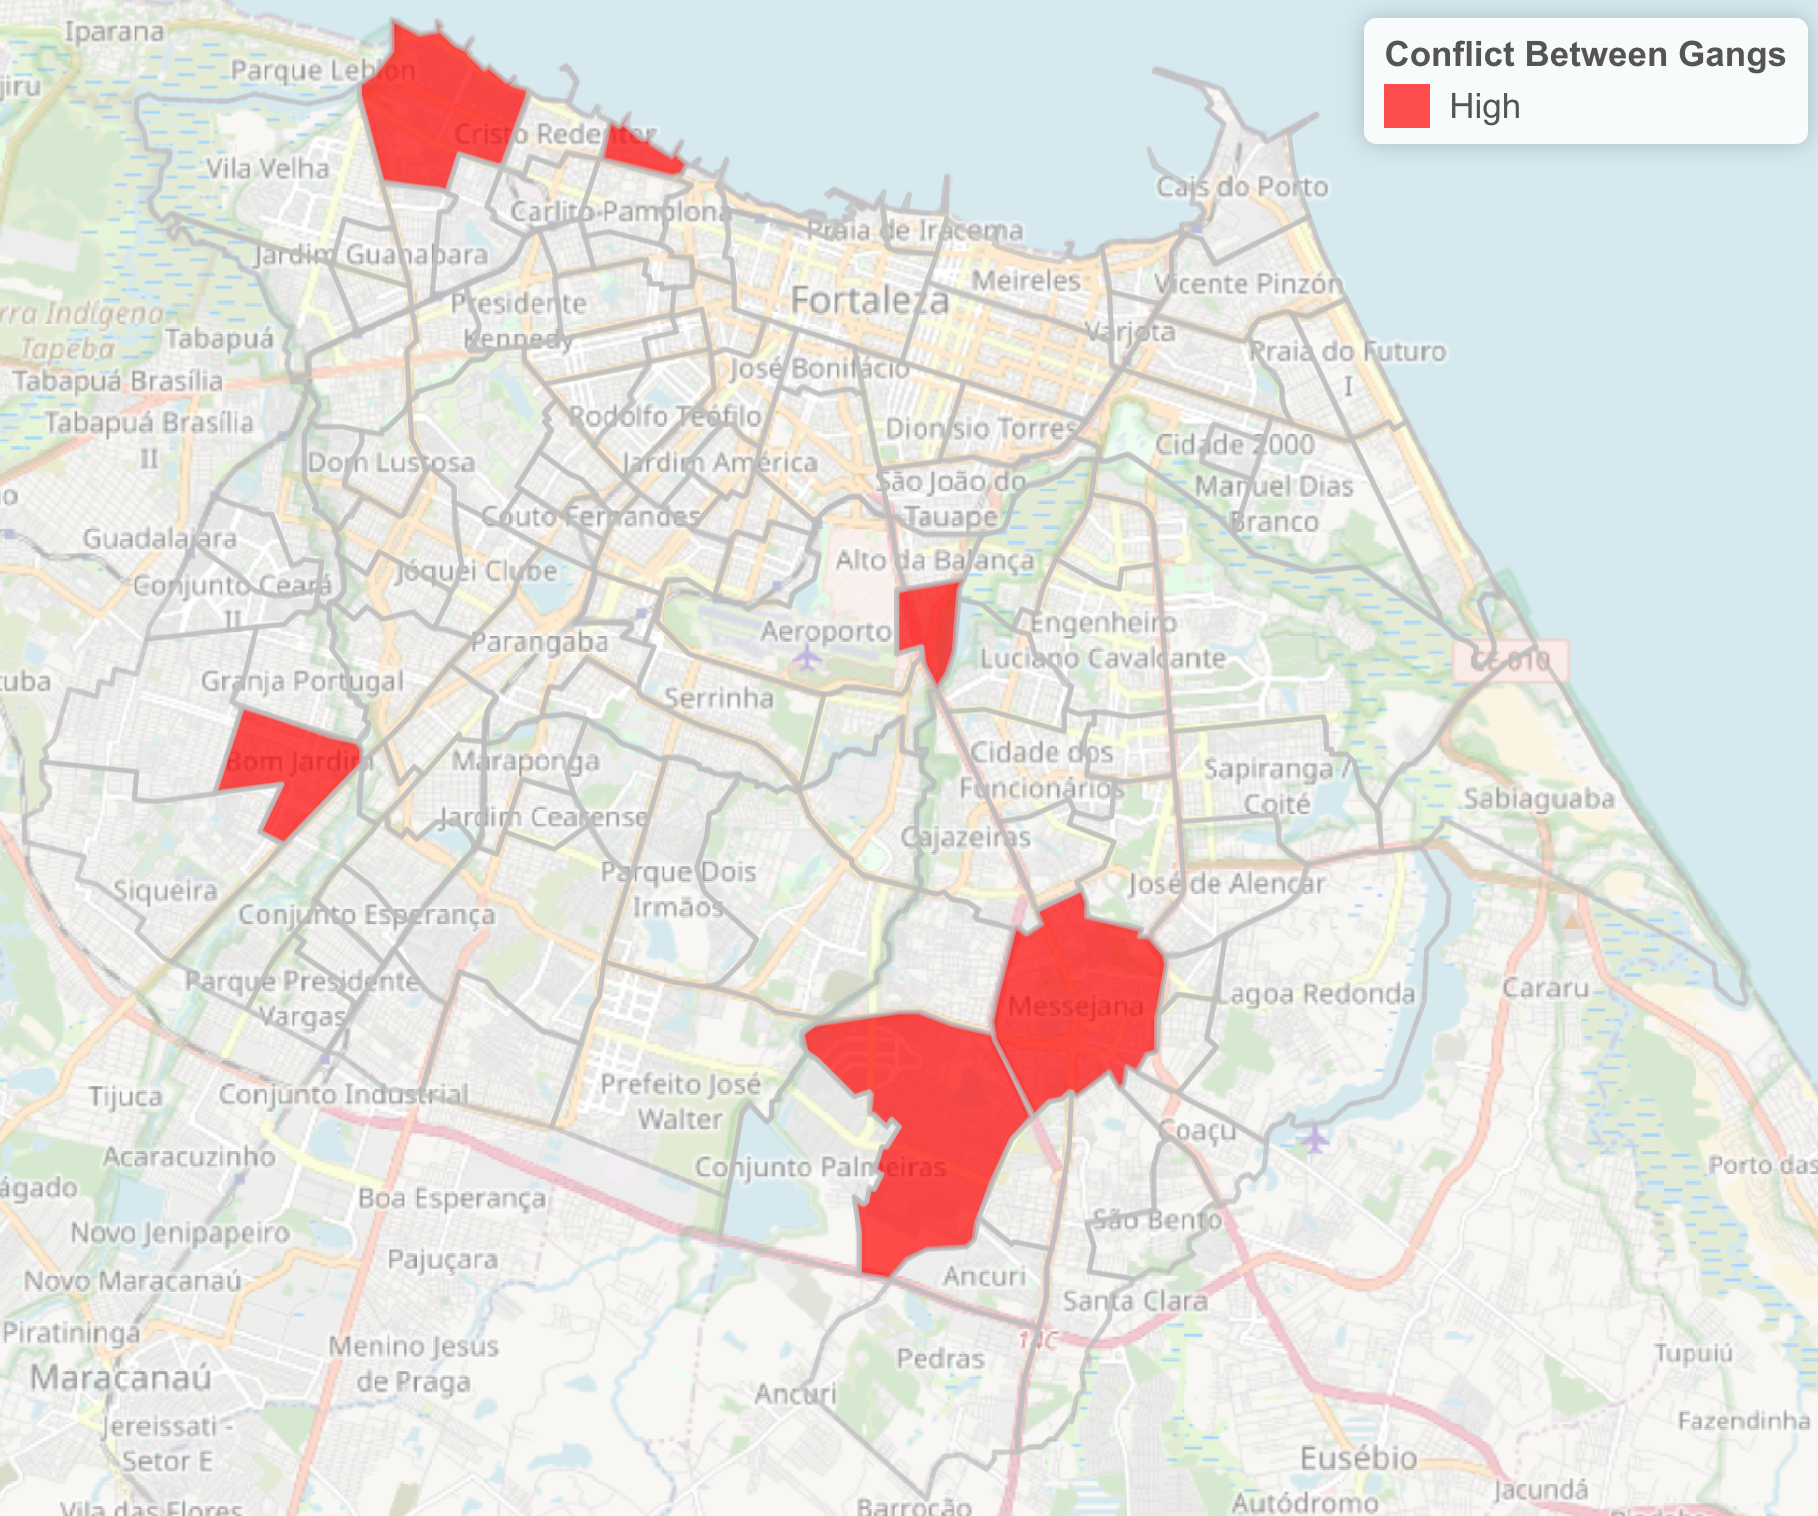
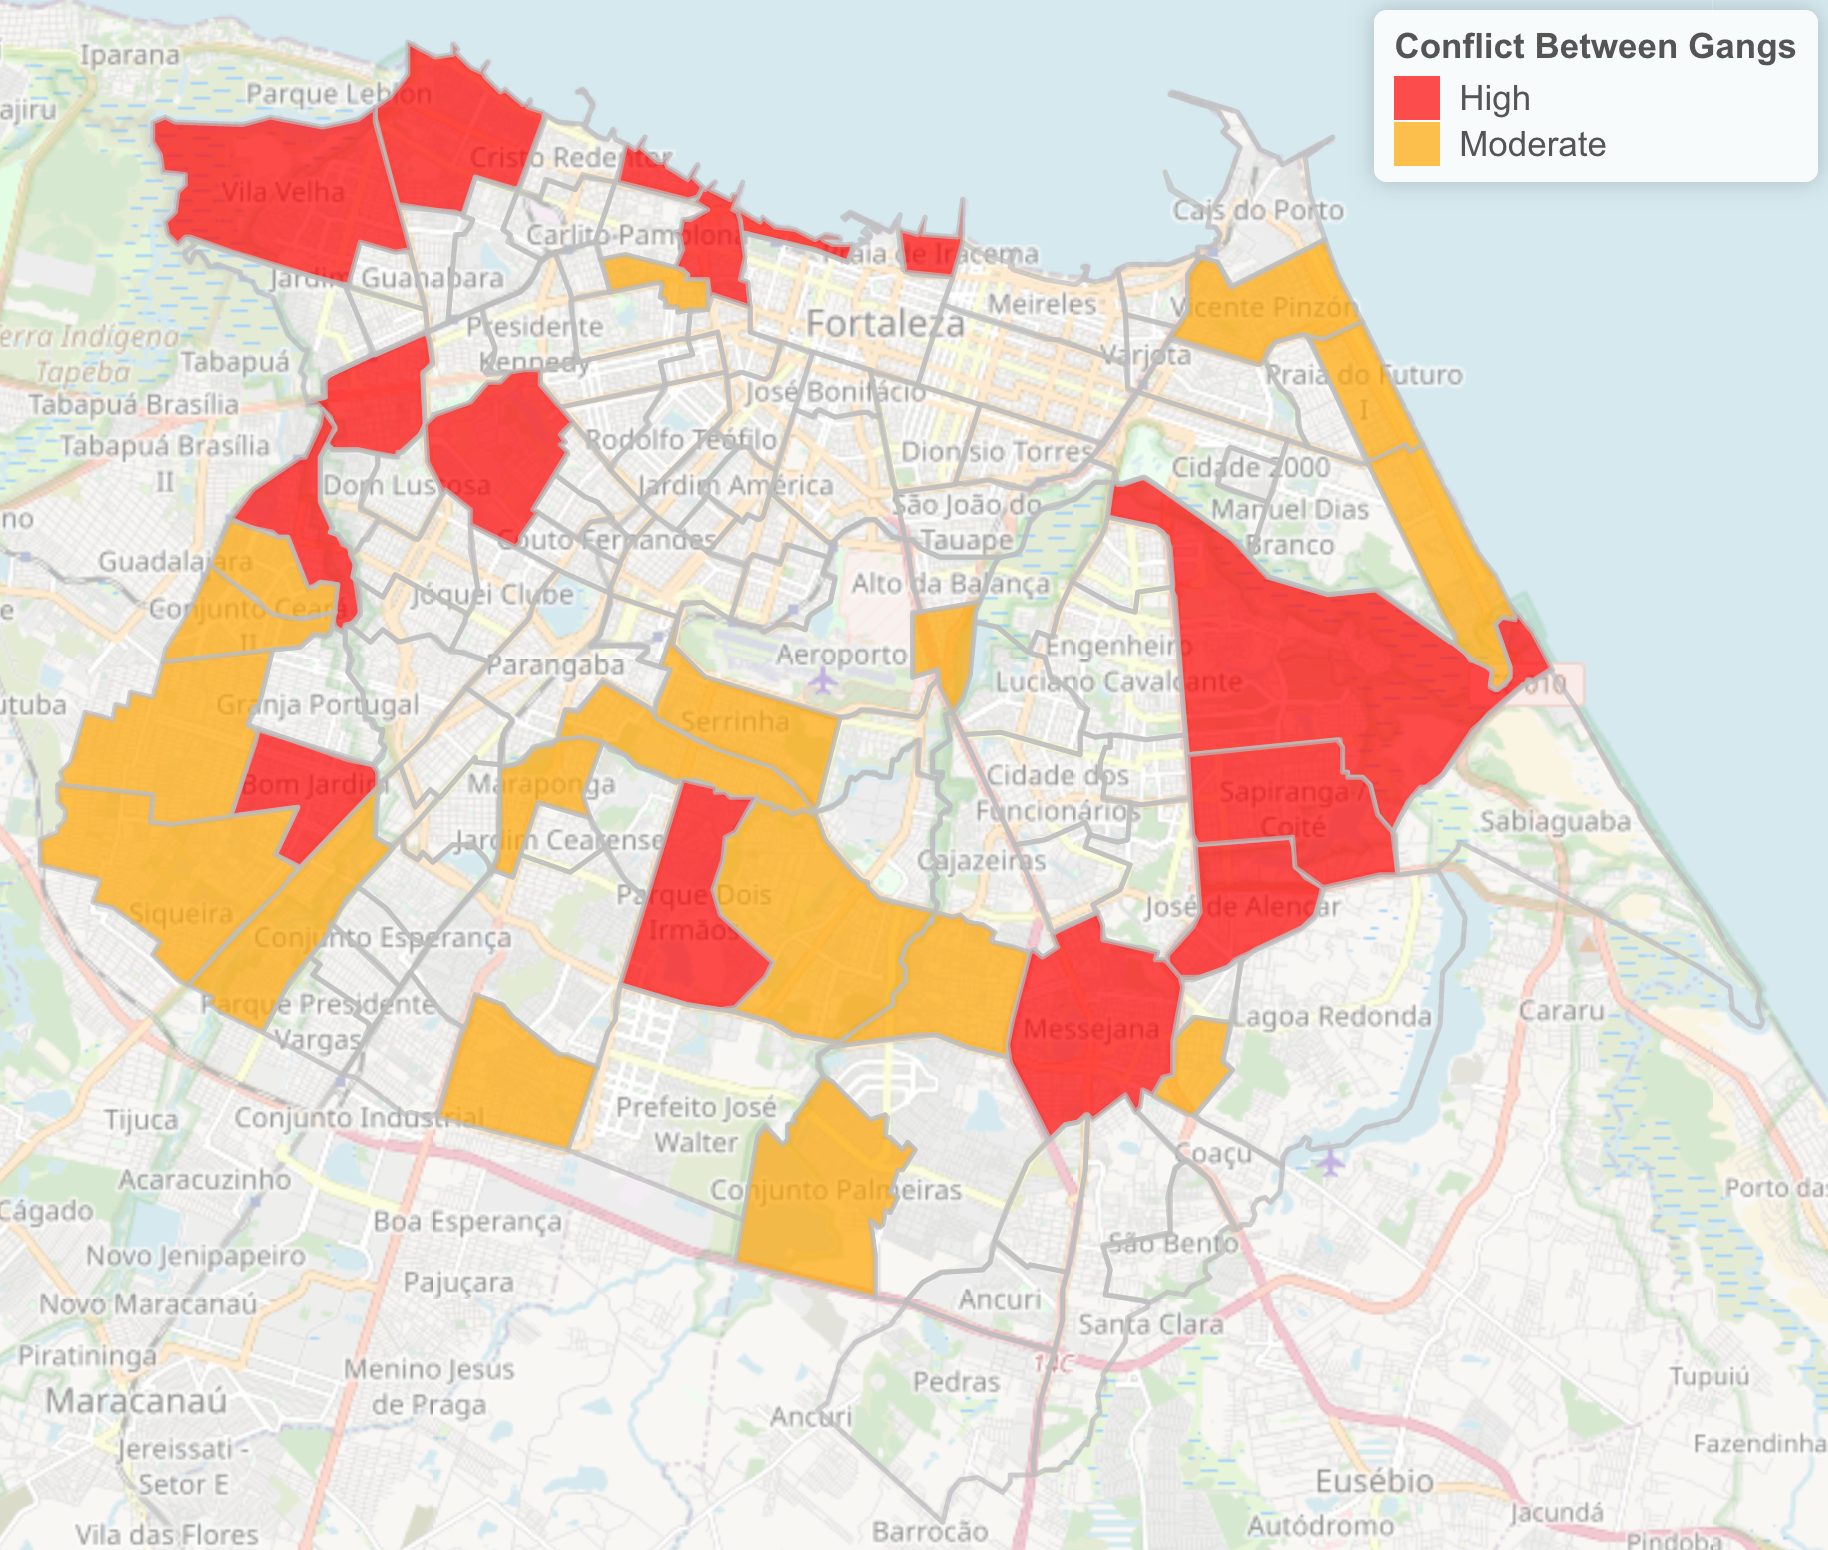
Fortaleza-CE commonly ranks as one of the most violent cities in the world, with homicide rates close to Cali-COL, St Louis-USA, New Orleans-USA, and Baltimore-USA
Between 2004 and 2015, homicide rates more than double. Many factors contributed to the violence escalation: from a police strike at the end of 2011 to the rise of crime syndicates
In 2019 the city managed to cut murder rates by more than 50%, compared to the previous year. However, in February 2020, the Military Police went on a general strike again, and the State went back to the top of the murder rates ranking
Detailed information about 12,081 murders within Fortaleza’s boundaries between January 1st, 2012 and November 30th, 2019
The 8,291 homicides that happened on the streets are considered in the analysis
5,560 murders occurred between 8:00 am and 10:00 pm
Murders are aggregated to months and at the census tract level. The outcome is homicide rates per 1,000 people
Note: complete addresses were converted to coordinates (lat and lon) using Google’s API
Research Design - Murders
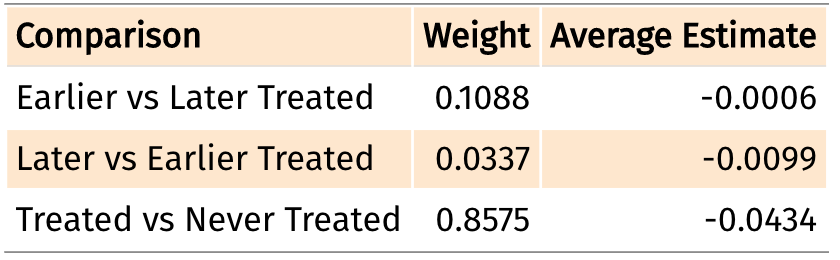
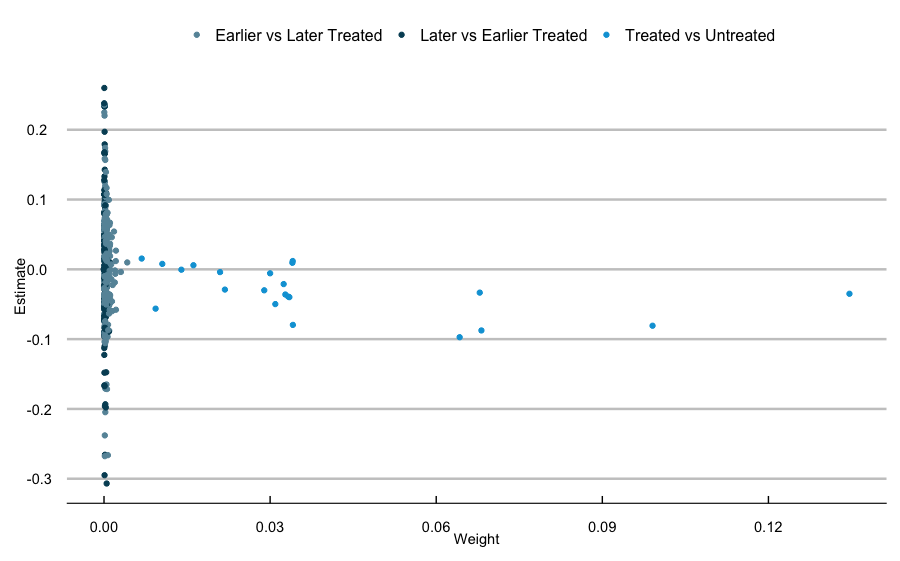
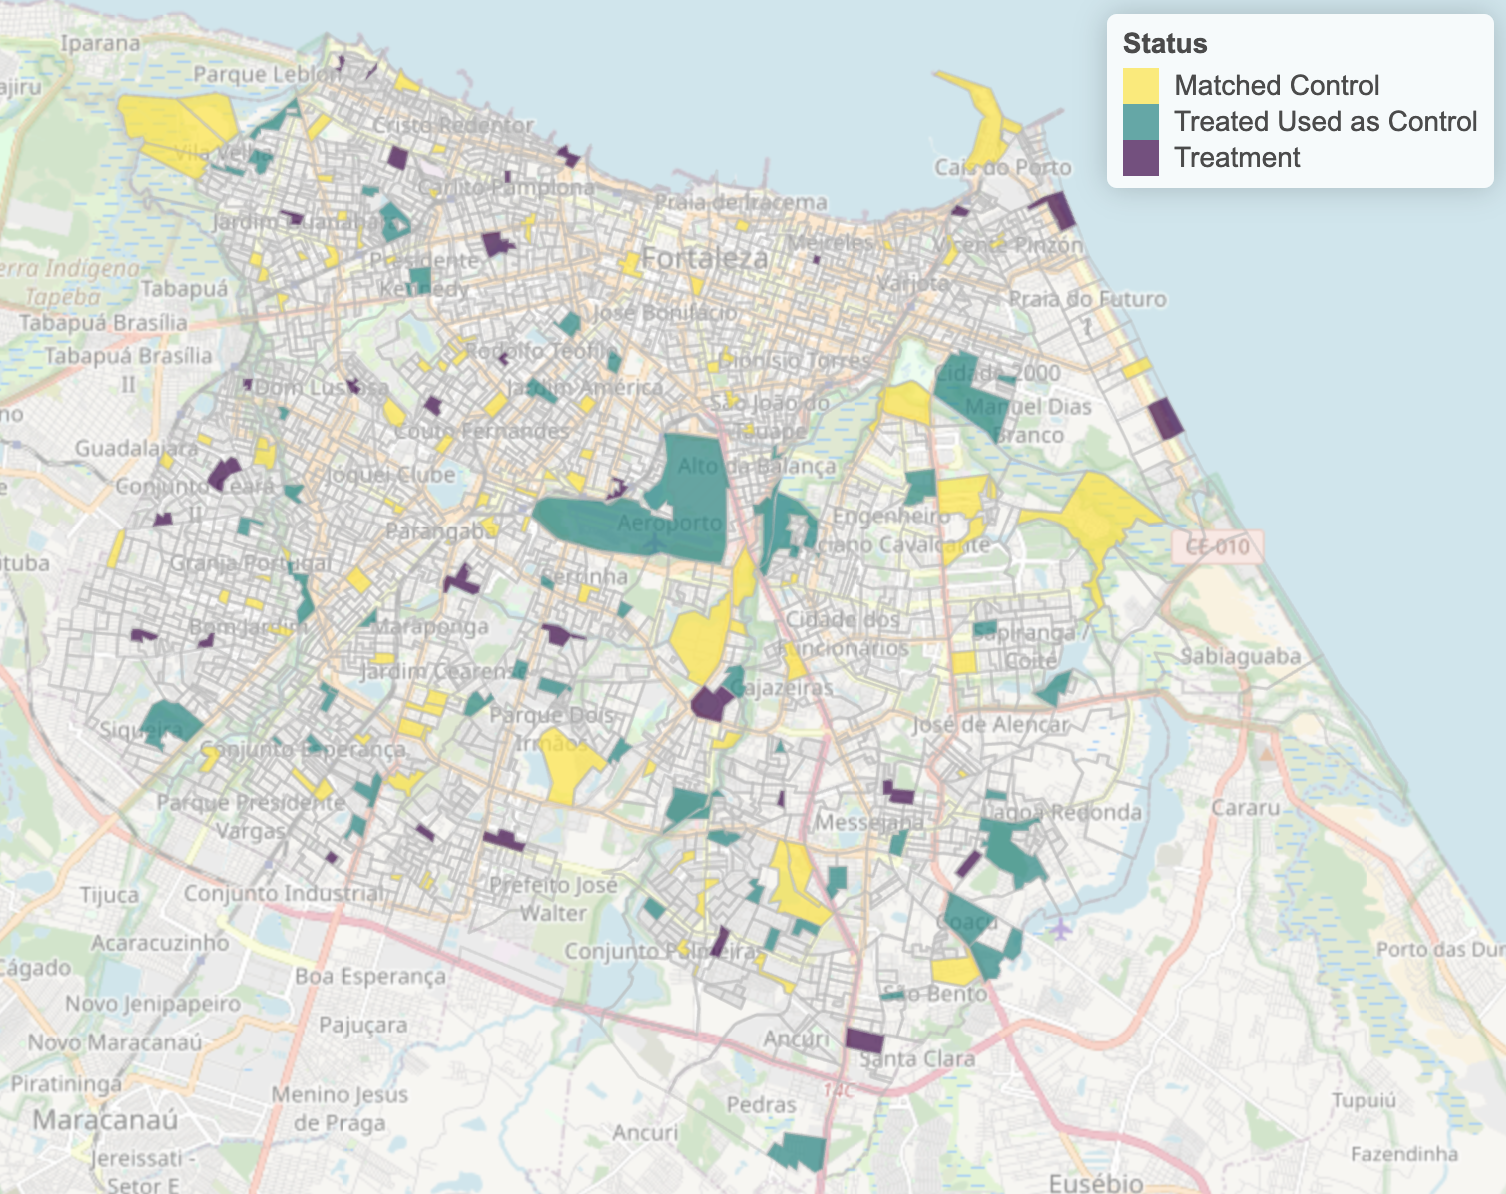
I conjecture tracts treated until July 2019 and after January 2020 are similar in observables and unobservables, and this control group’s choice produces an apples-to-apples comparison
Potential control areas within 650 meters of a treated neighborhood are excluded (2), as well as fields built between September and December 2019 (11)
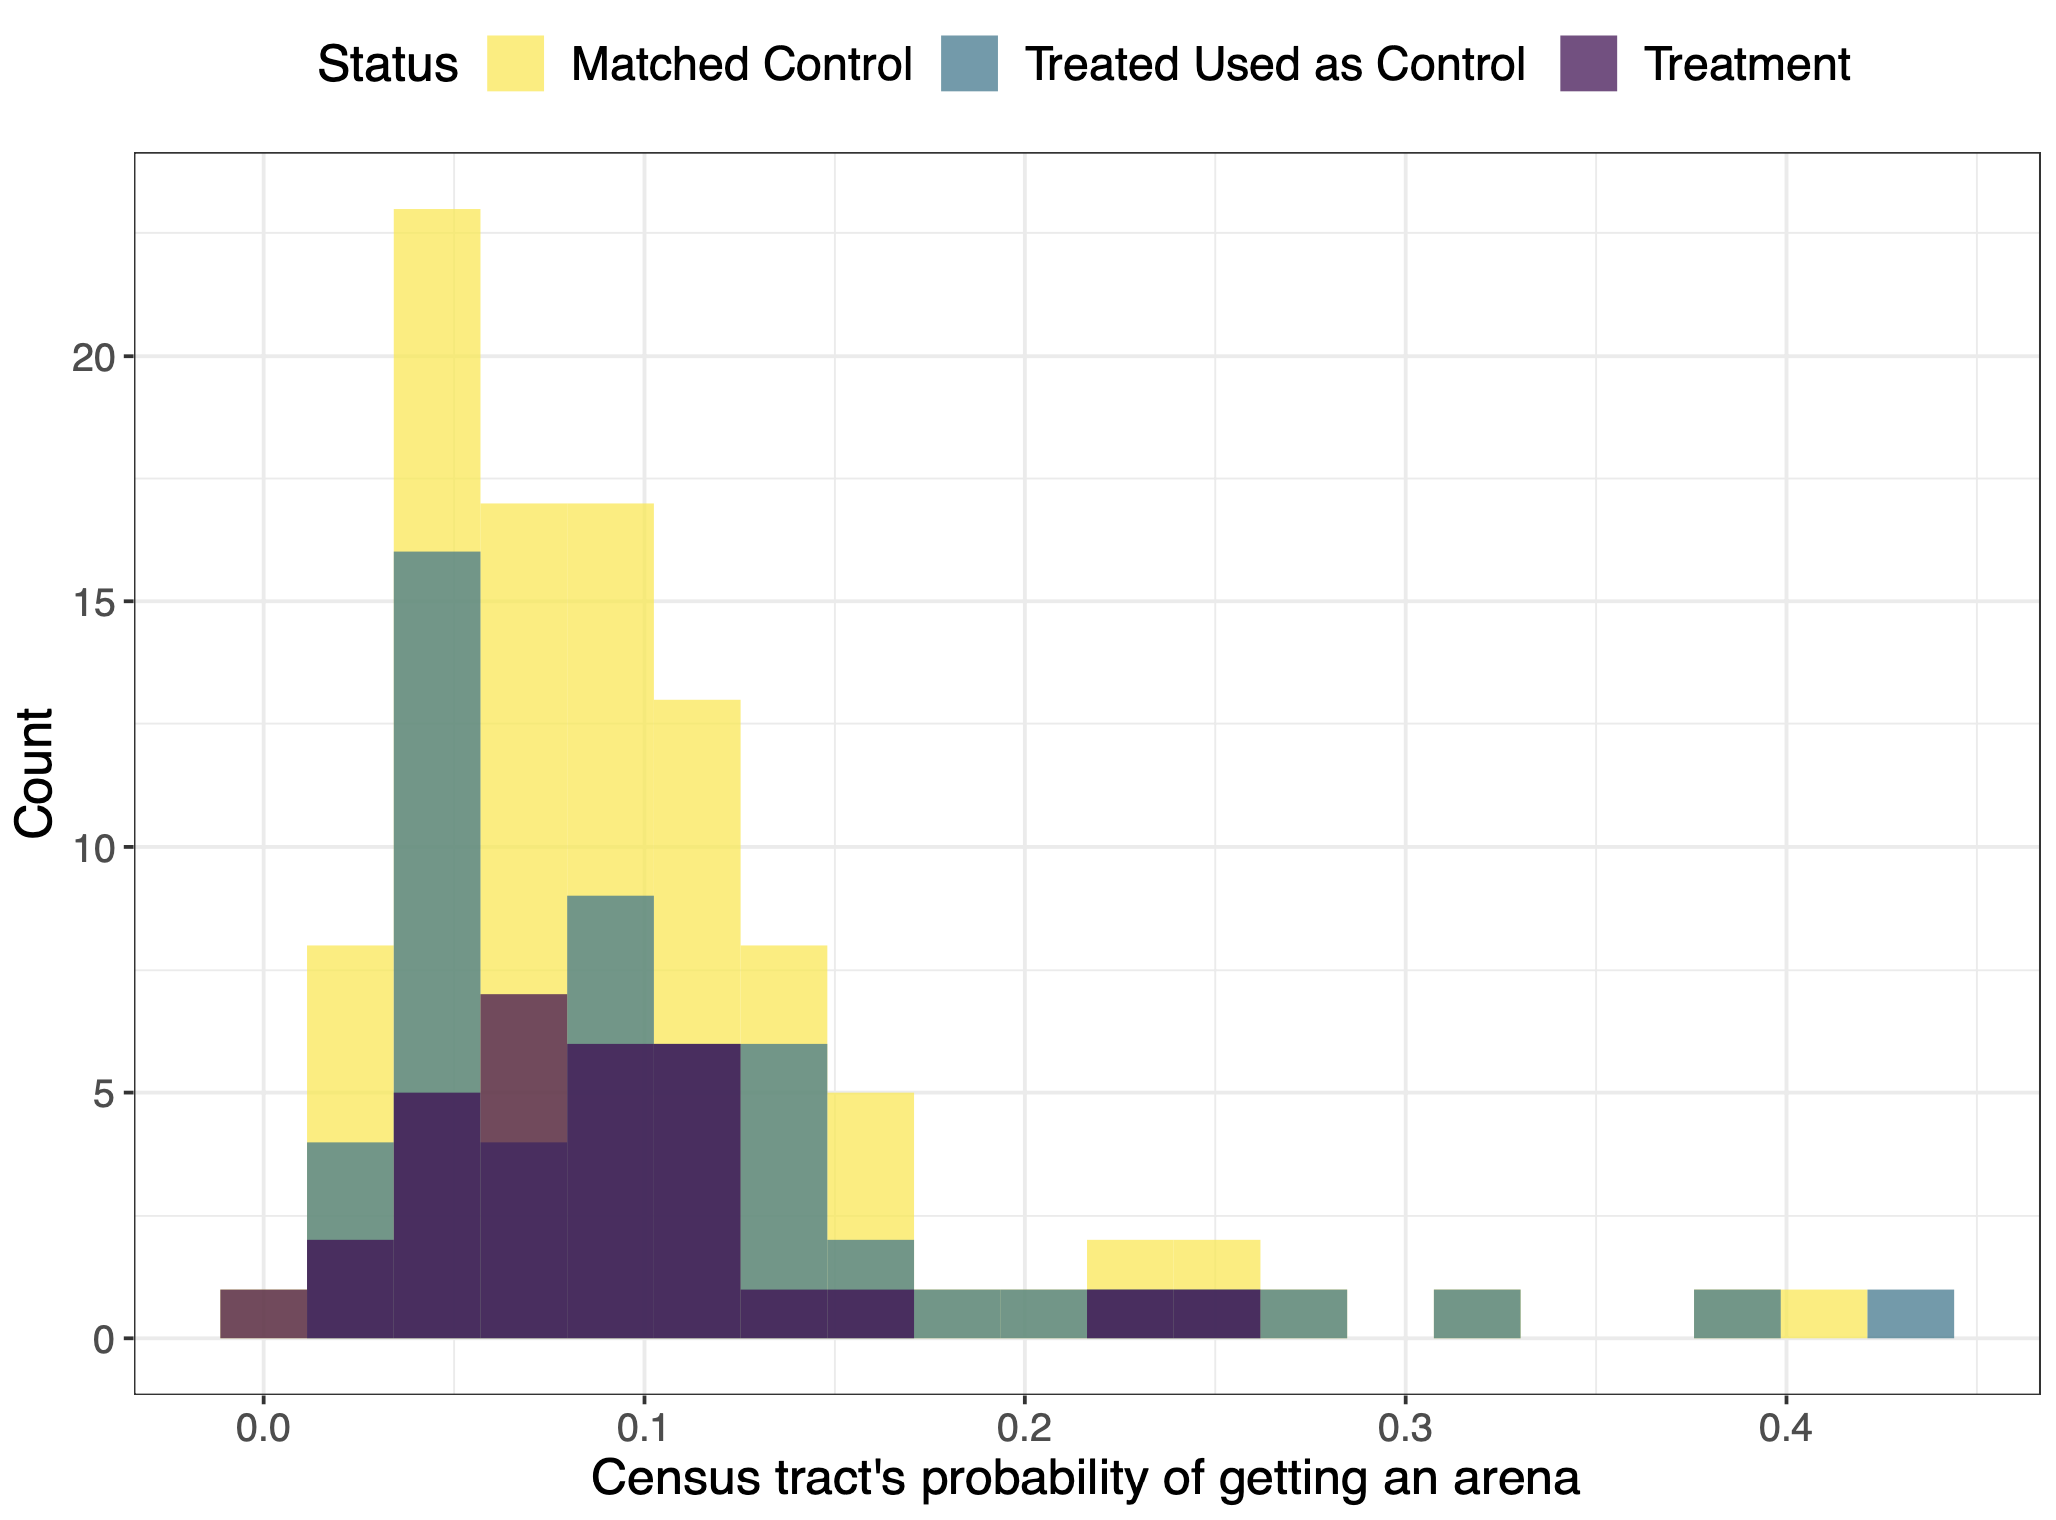
Different comparison groups are also built by matching similar never treated neighborhoods using neighborhoods and boroughs’ demographics available in Census 2010
In total, there are 31 treated and 55 control neighborhoods
Total population in treated areas is 28,365 and in control tracts is 51,017
This sample covers 3.2% of the city’s population and around 6% of land area
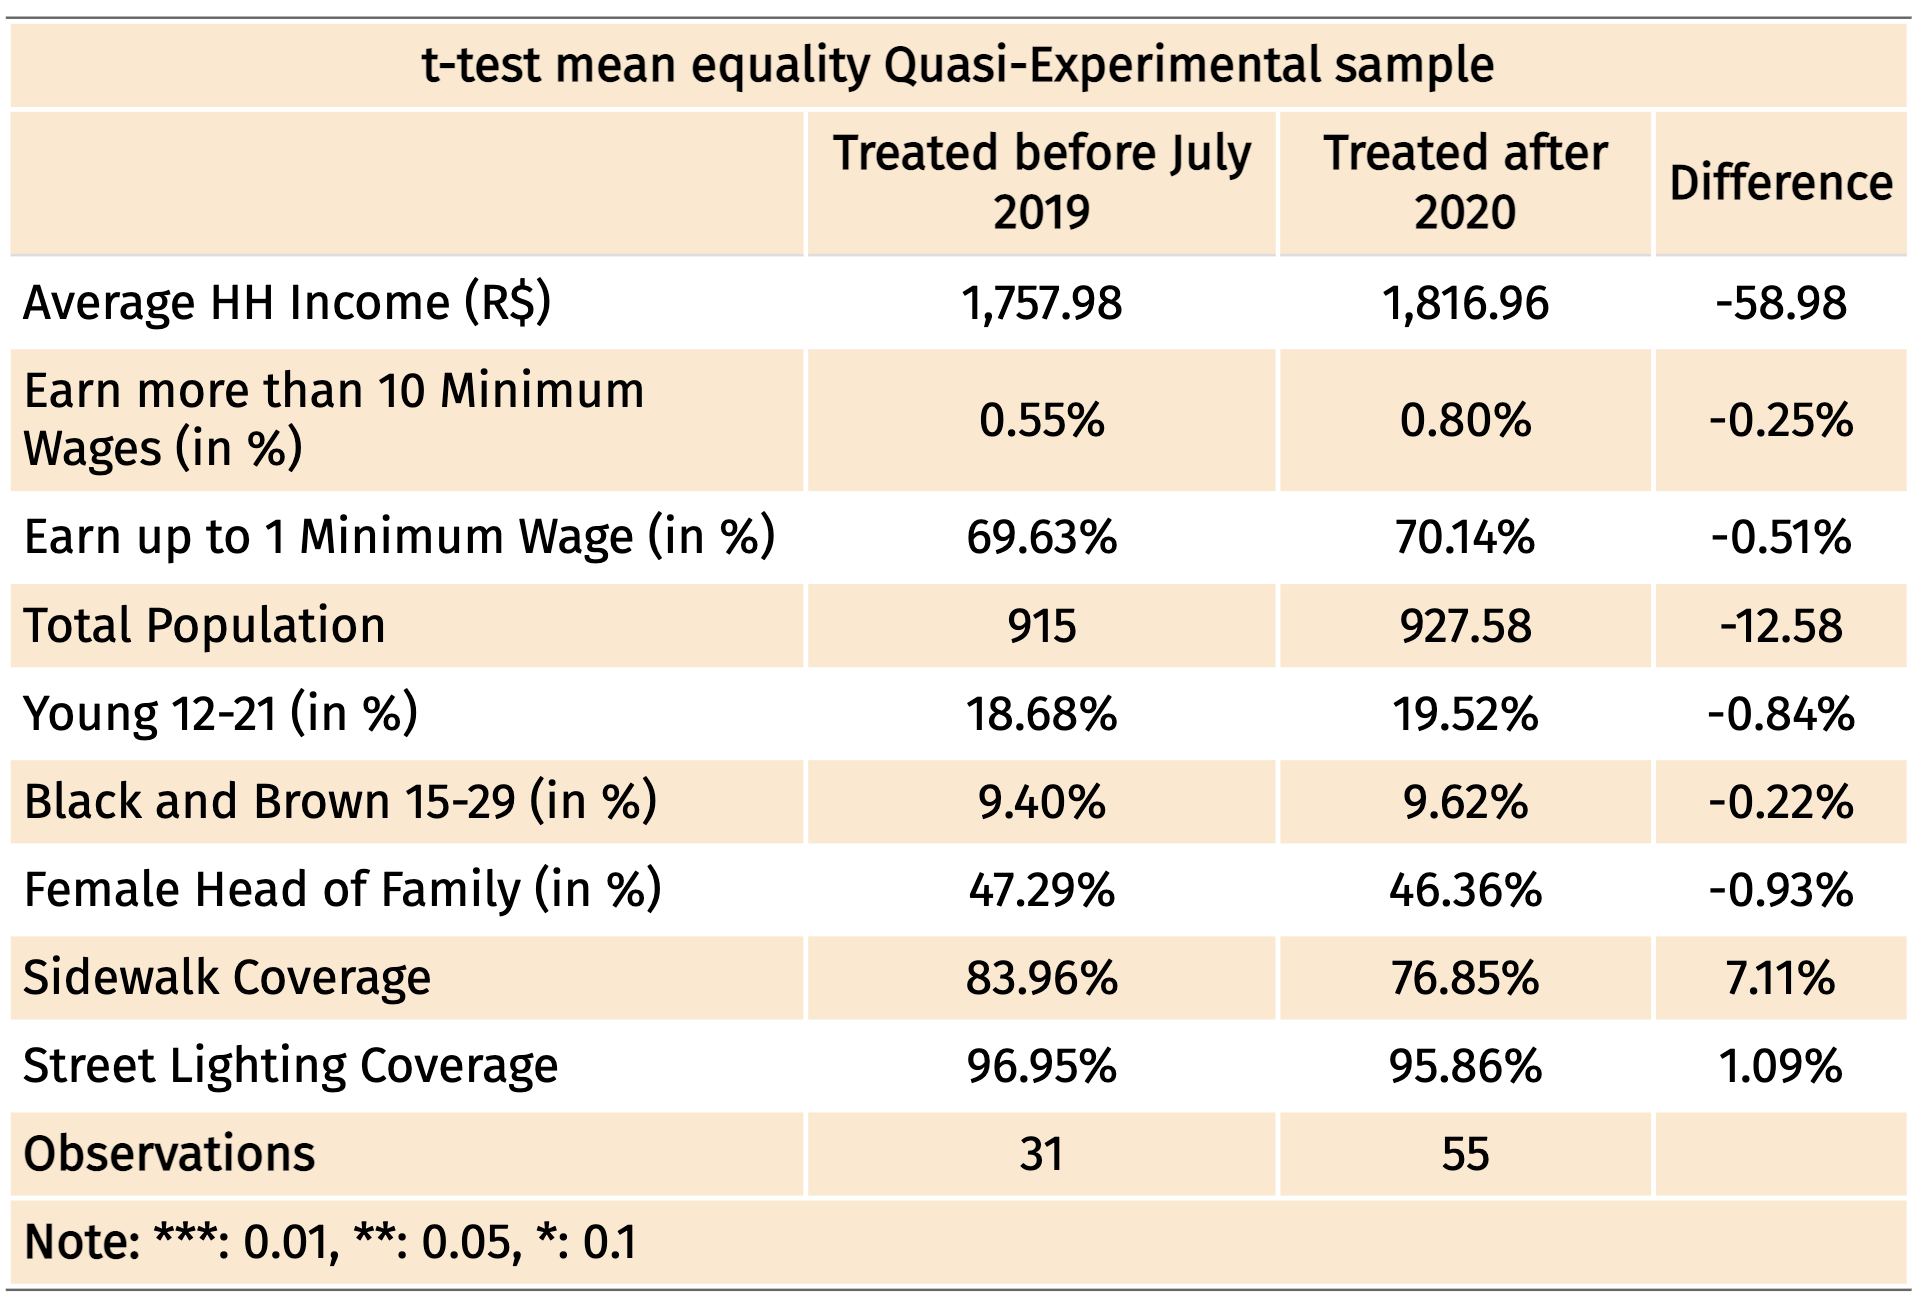
To account for endogeneity concerns and evaluate the impact of the Areninhas Project, I combine the difference-in-differences design with a comparison group based on areas treated after the sample final year and/or matched places.
The causal effect of the neighborhood intervention is estimated using the following:
\[\text{Murder Rate}_{im}=\lambda_{m}+\gamma_{i}+\beta Open_{im}+\varepsilon_{im}\text{ } \text{ } \text{ }\text{ }\text{ } (1)\]
where \(\lambda_{m}\) is the time fixed effects (month-year), and \(\gamma_{i}\) refers to census tract fixed effects. \(\beta\) is the difference-in-differences estimate that captures the causal effect of interest
TWFE with Time-of-day heterogeneity
To check whether this urban intervention have different effects within hours of day, I consider the following:
\[\text{Murder Rate}_{iqt}=\lambda_{mt}+\gamma_{i} +\beta_{1}Open:Morning_{imt}+\beta_{2}Open:Afternoon_{imt}+\beta_{3}Open:Night_{imt}+\varepsilon_{imt}\text{ } \text{ } \text{ }\text{ }\text{ } (2)\]
where \(\lambda_{mt}\) represents month-year-time-of-day fixed effects. The morning covers the hours from 8 to 11:59 am, afternoon 12:00 pm until 5:59 pm, and night 6:00 pm to 9:59 pm. The omitted category is ‘closed,’ covering the hours from 10:00 pm to 7:59 am.
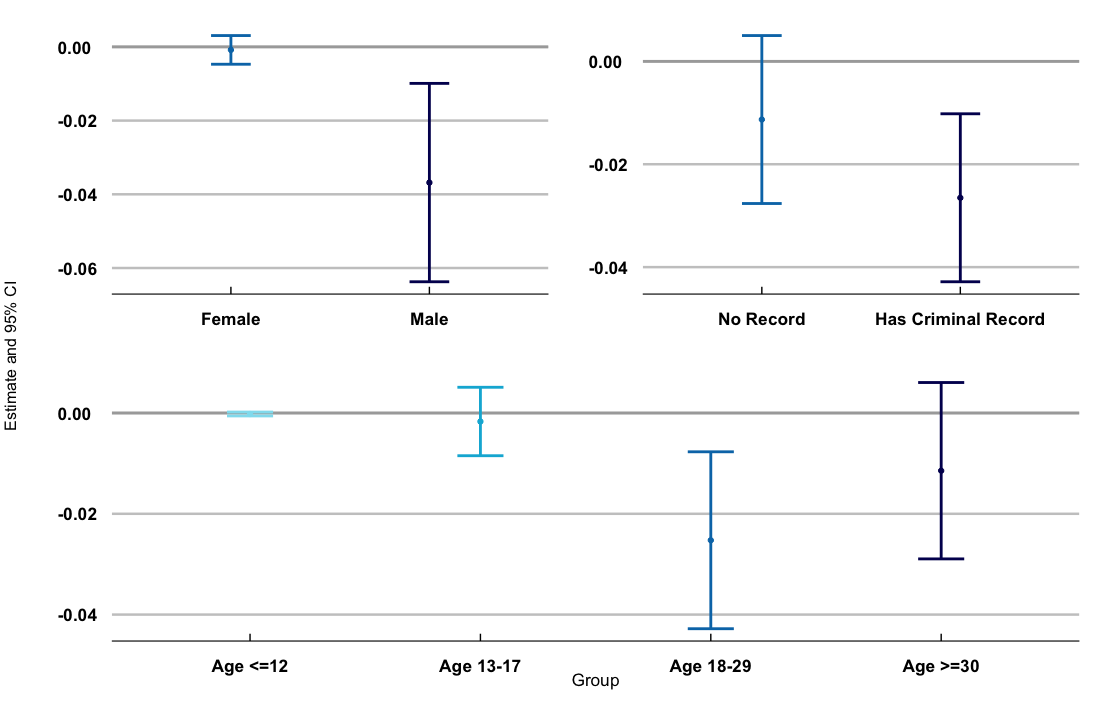
TWFE splitting the sample: Day-of-week, Age, Gender, and Criminal record heterogeneity
To estimate gender, day-of-week, age and criminal record-specific effects, I consider the following:
\[\text{Murder Rate}^{j}_{im}=\lambda_{m}+\gamma_{i}+\beta Open_{im}+\varepsilon_{im} \text{ } \text{ } \text{ }\text{ }\text{ }(3)\]
where \(\text{Murder Rate}^{j}_{im}\) is the outcome measured in tract \(i\) for deceased individuals of gender/of age/with criminal-record/at day-of-week \(j\) in month \(m\).
Results Crime I
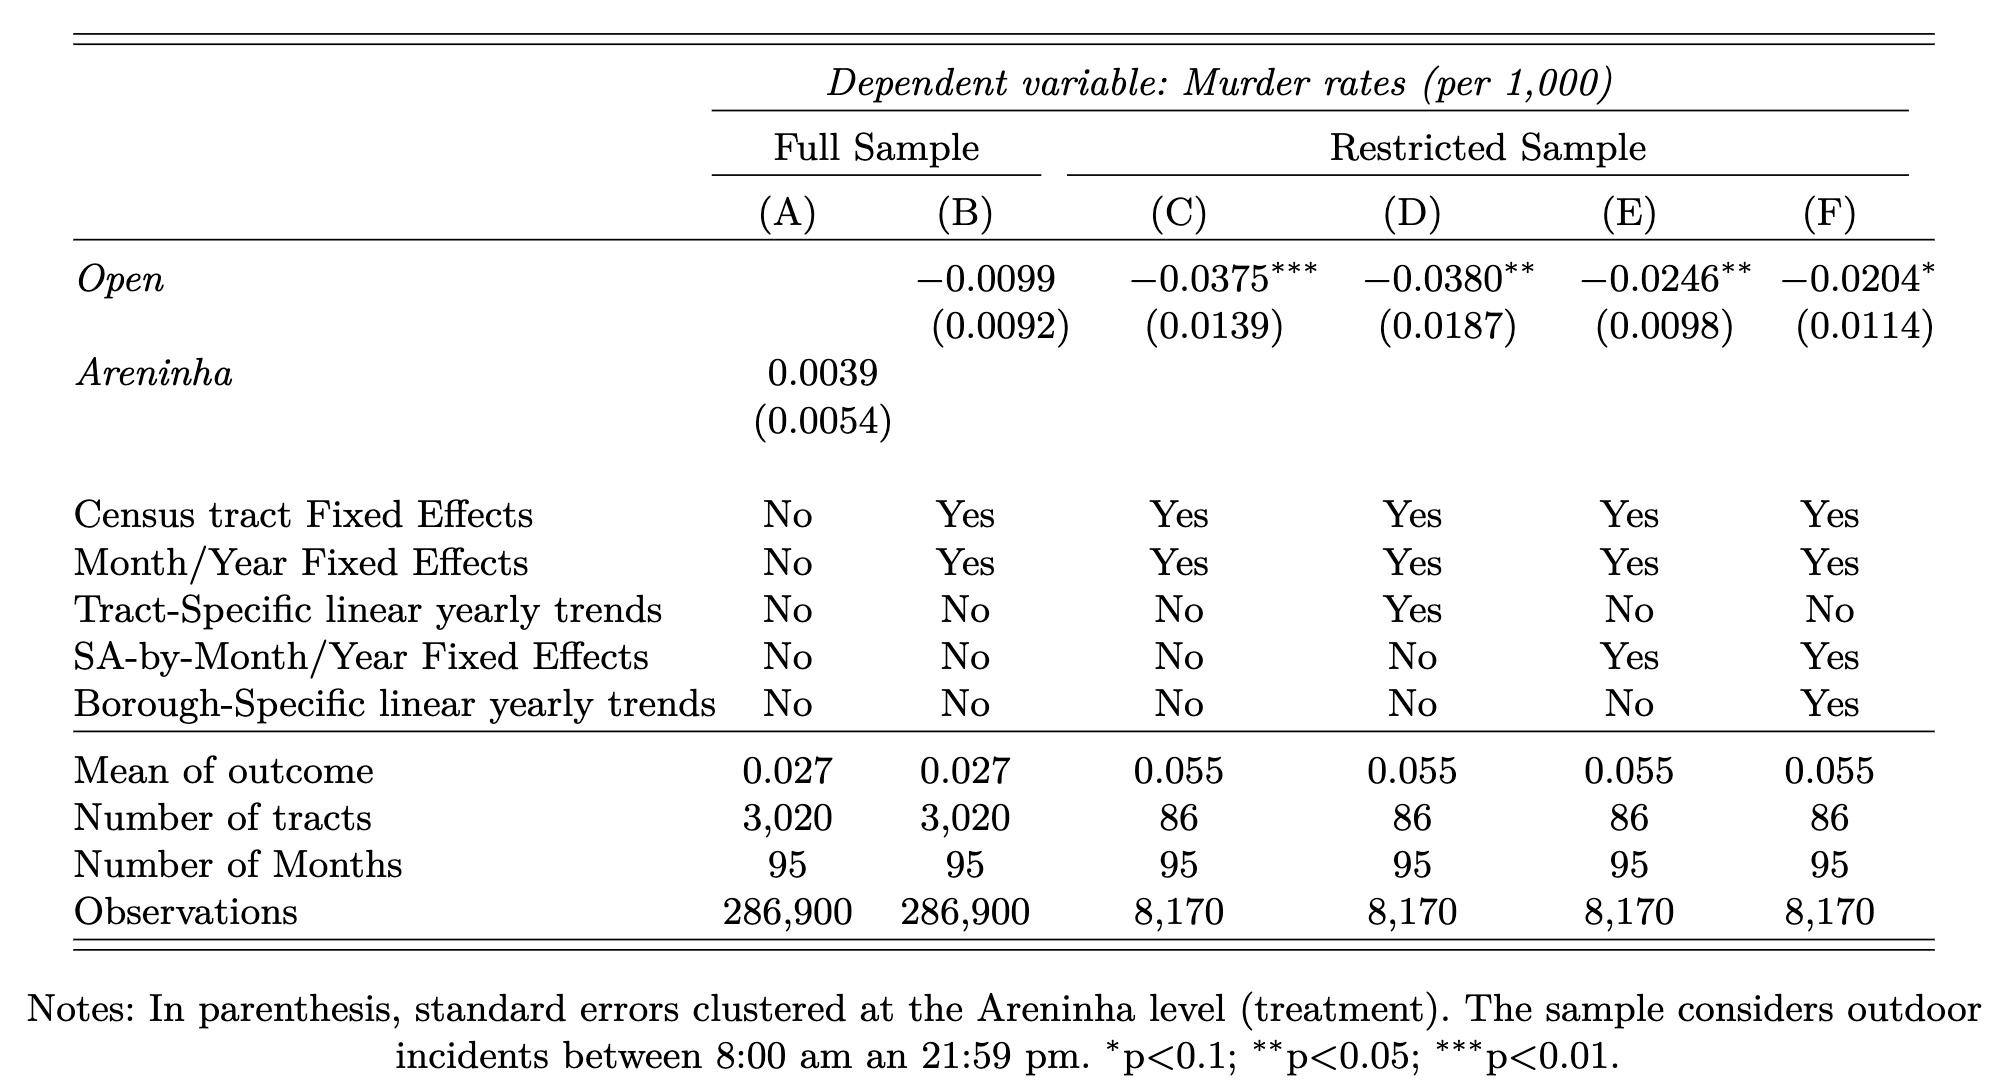
(A) shows a naive comparison of murder rates between treated census tracts and the rest of the city. (B) still uses full sample, but exploits the staggered rollout of the urban policy
(C) to (F) use the quasi-experimental sample. Results are statistically significant and meaningful: the urban renewal policy caused a decrease in murder rates around 45-68% in treated neighborhoods
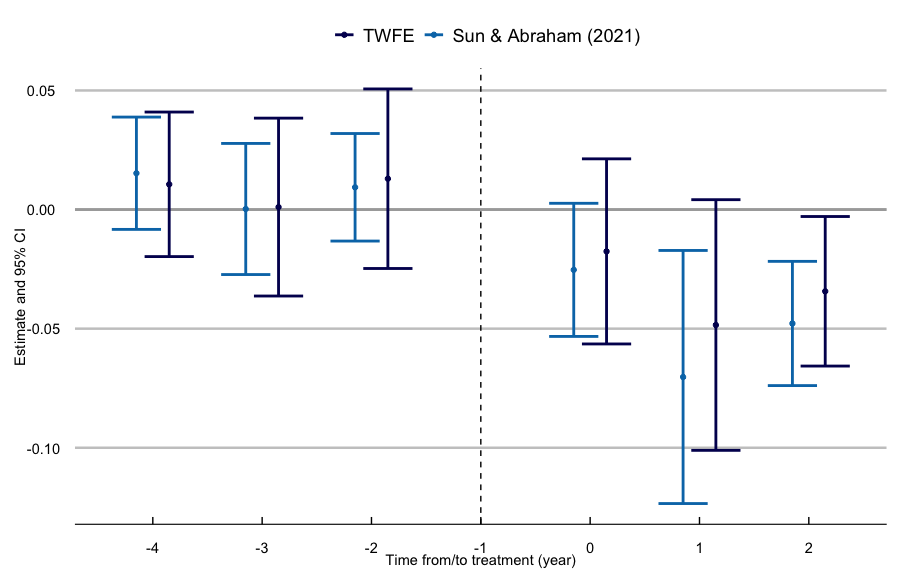
Dynamic treatment effects are estimated by
\[\small\text{Murder Rate}_{im}=\lambda_{m}+\gamma_{i}+\sum_{\tau=-4, \tau \neq -1}^{2}\beta_{\tau} Open_{i\tau}+\varepsilon_{im}\]
where months are binned to years, and endpoints are also binned at -4 (or less) and 2 (or more). Coefficients are normalized to event time -1
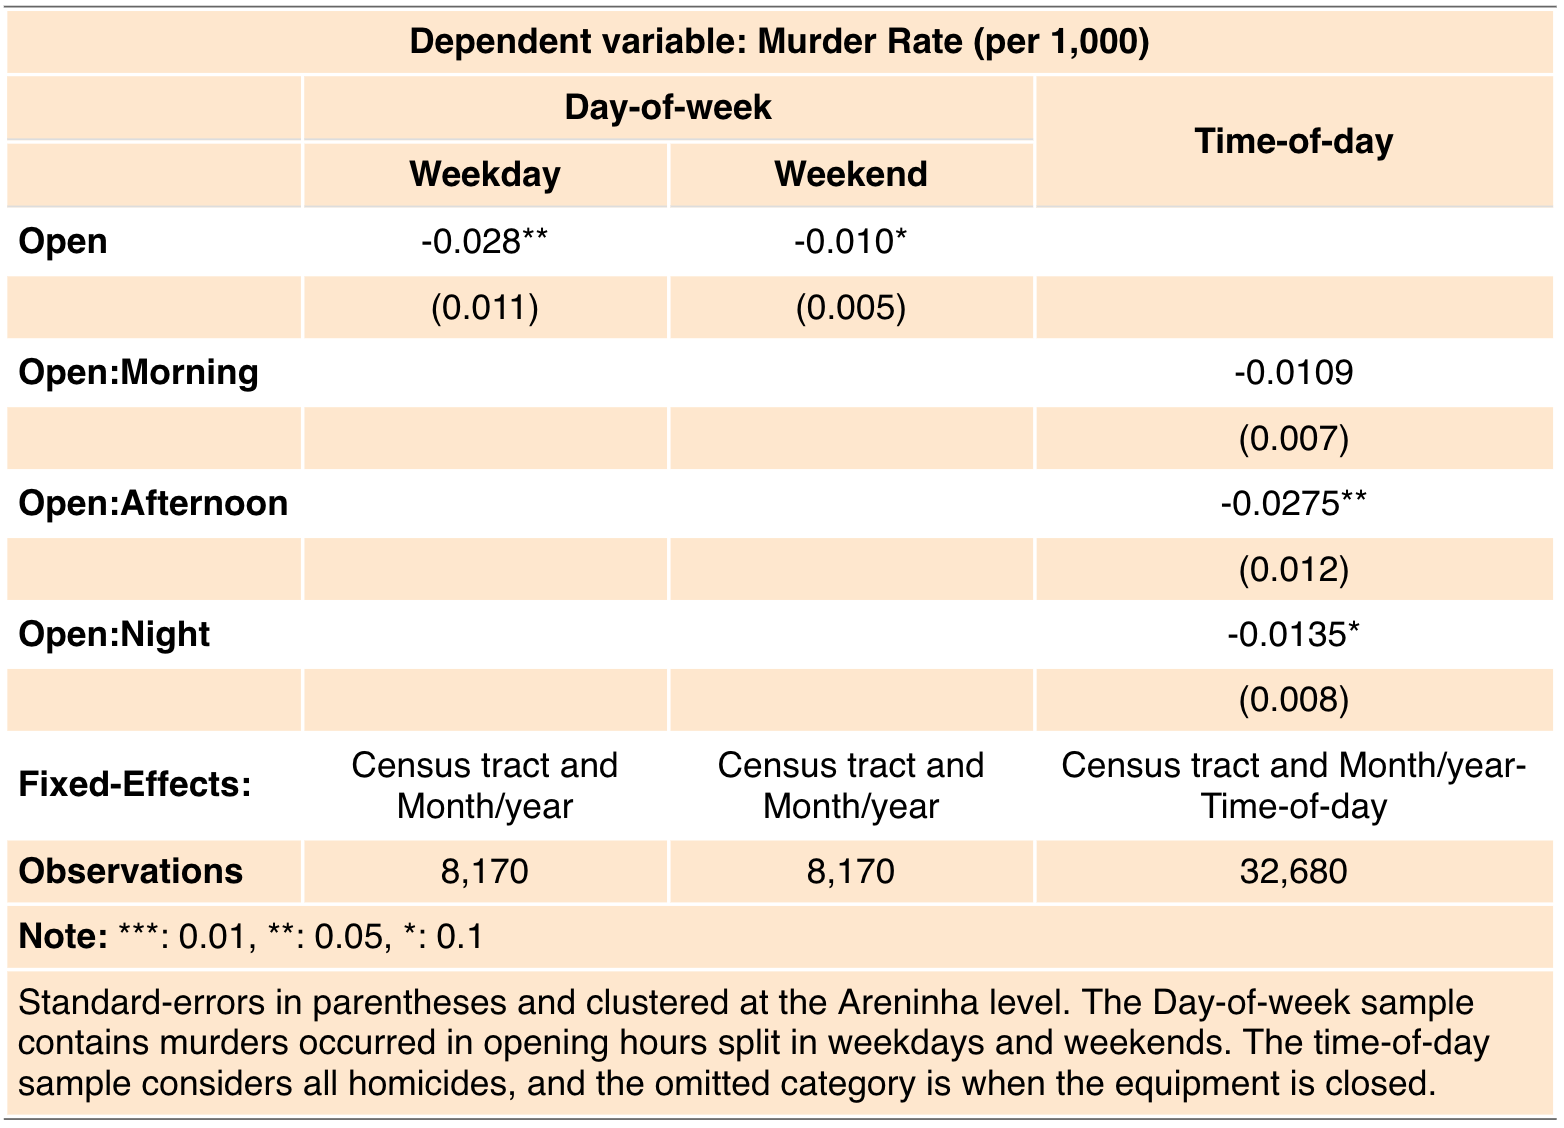
Day-of-week columns show a larger effect during weekdays, and time-of-day analysis points to a bigger effect during the afternoon (from 12 pm to 5:59 pm) - when most social projects happen
Pupils that study during the afternoon and commute from home to school around 1:00 pm and from school to home between 5:00-5:30 pm would benefit the most
The effect is driven by males aged 18-29 with past criminal record, which suggests fewer gang fights in treated areas
Although there is anecdotal evidence of young males leaving the drug trafficking in these areas, incapacitation effect is hard to identify
Results Crime II
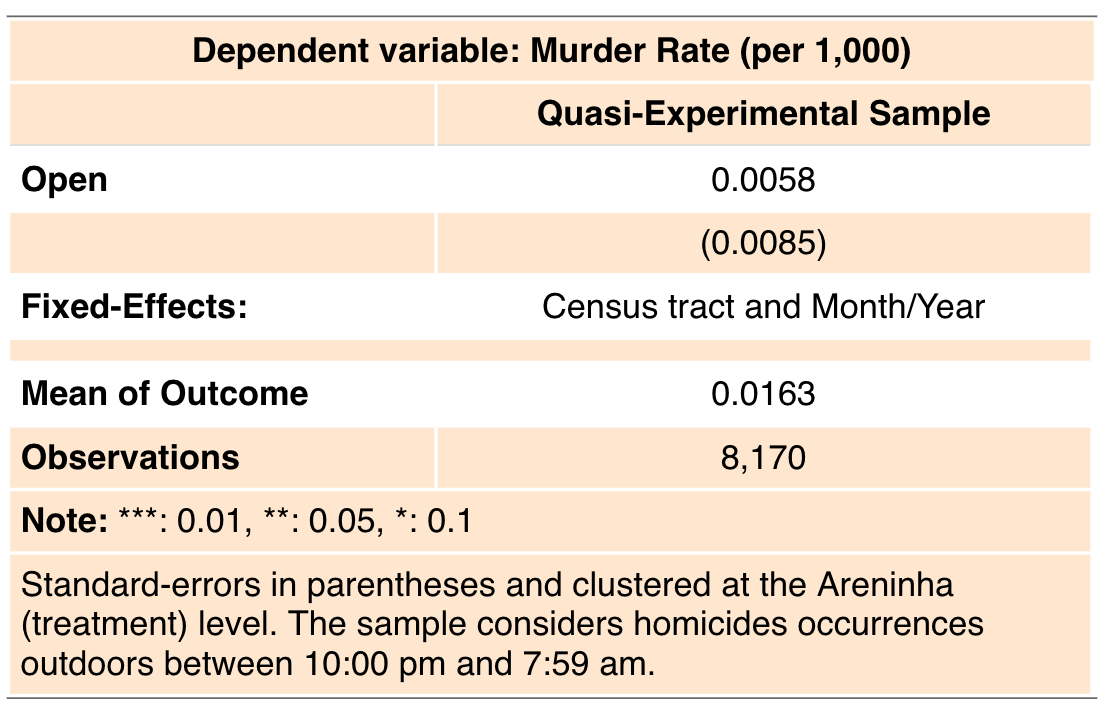
Temporal displacement is estimated using equation (1) but with murders happening during closed hours - from 22:00 pm to 7:59 am
Point estimate suggests an increase around 35% in homicide rates, but it is not statistically significant at usual levels (p-val=.49)
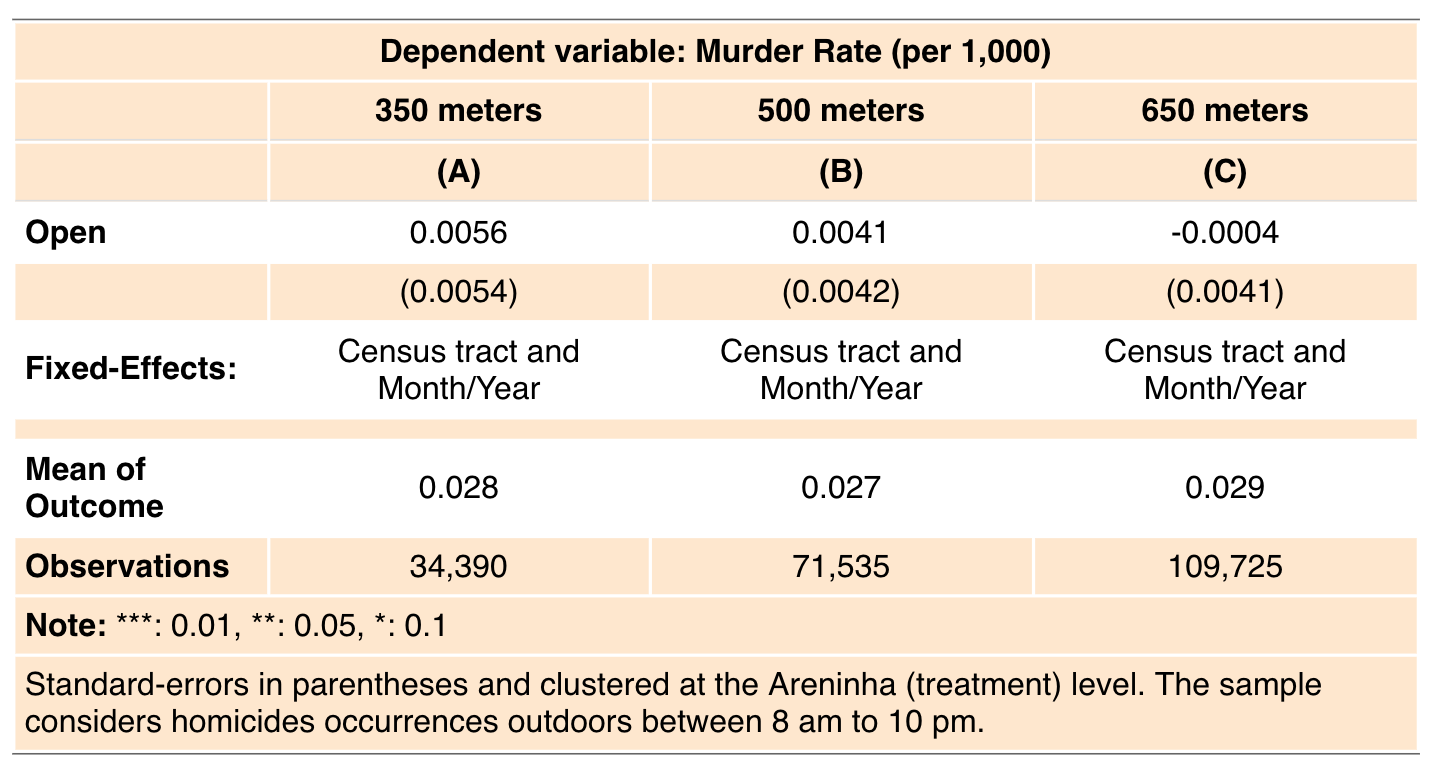
Neighborhoods are built around treated census tracts using the equipment’s distance to the other tracts’ centroids. The homicide data covers the opening hours
Point estimates are not statistically significant, and there is no evidence of crime moving around corners
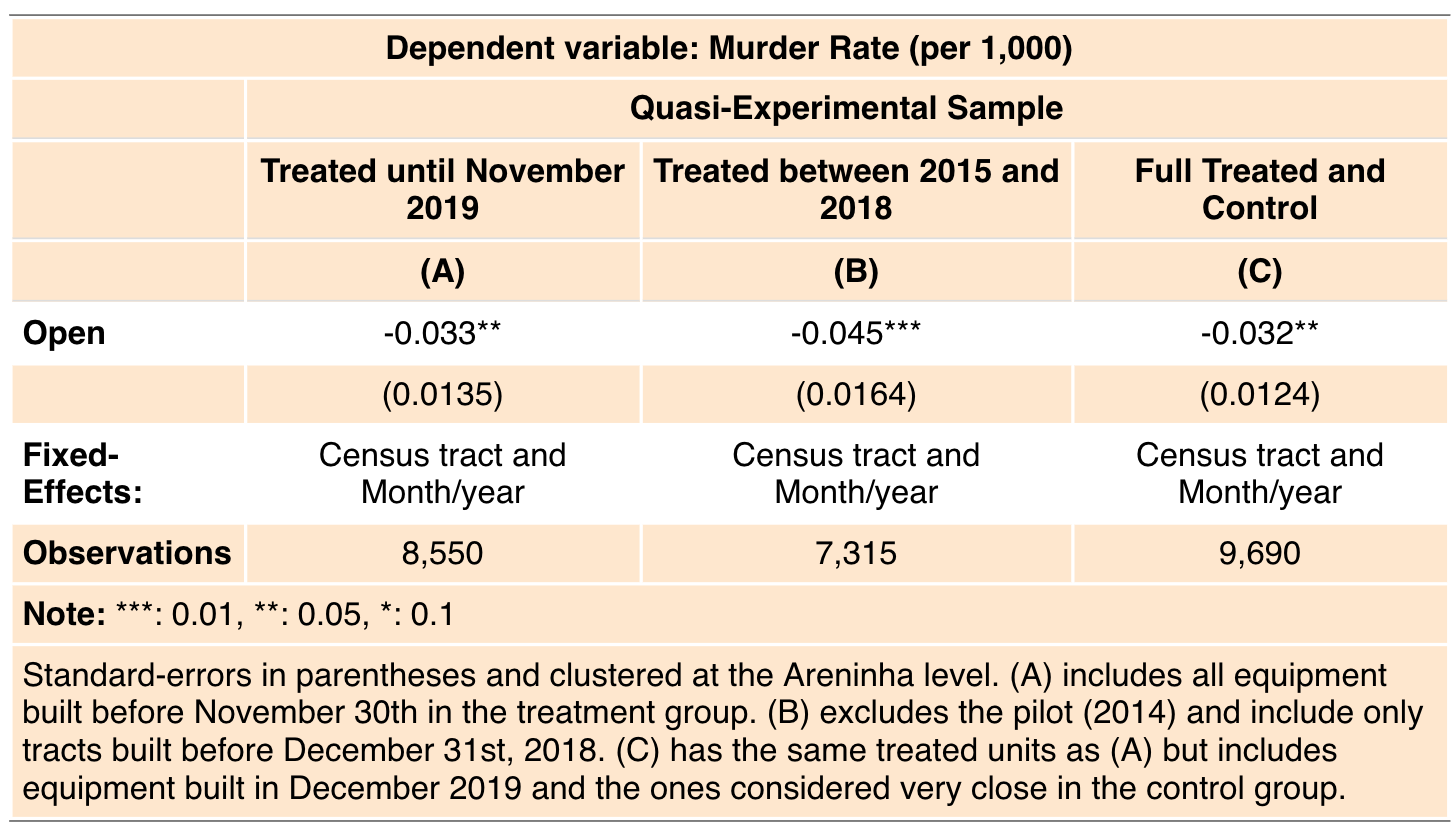
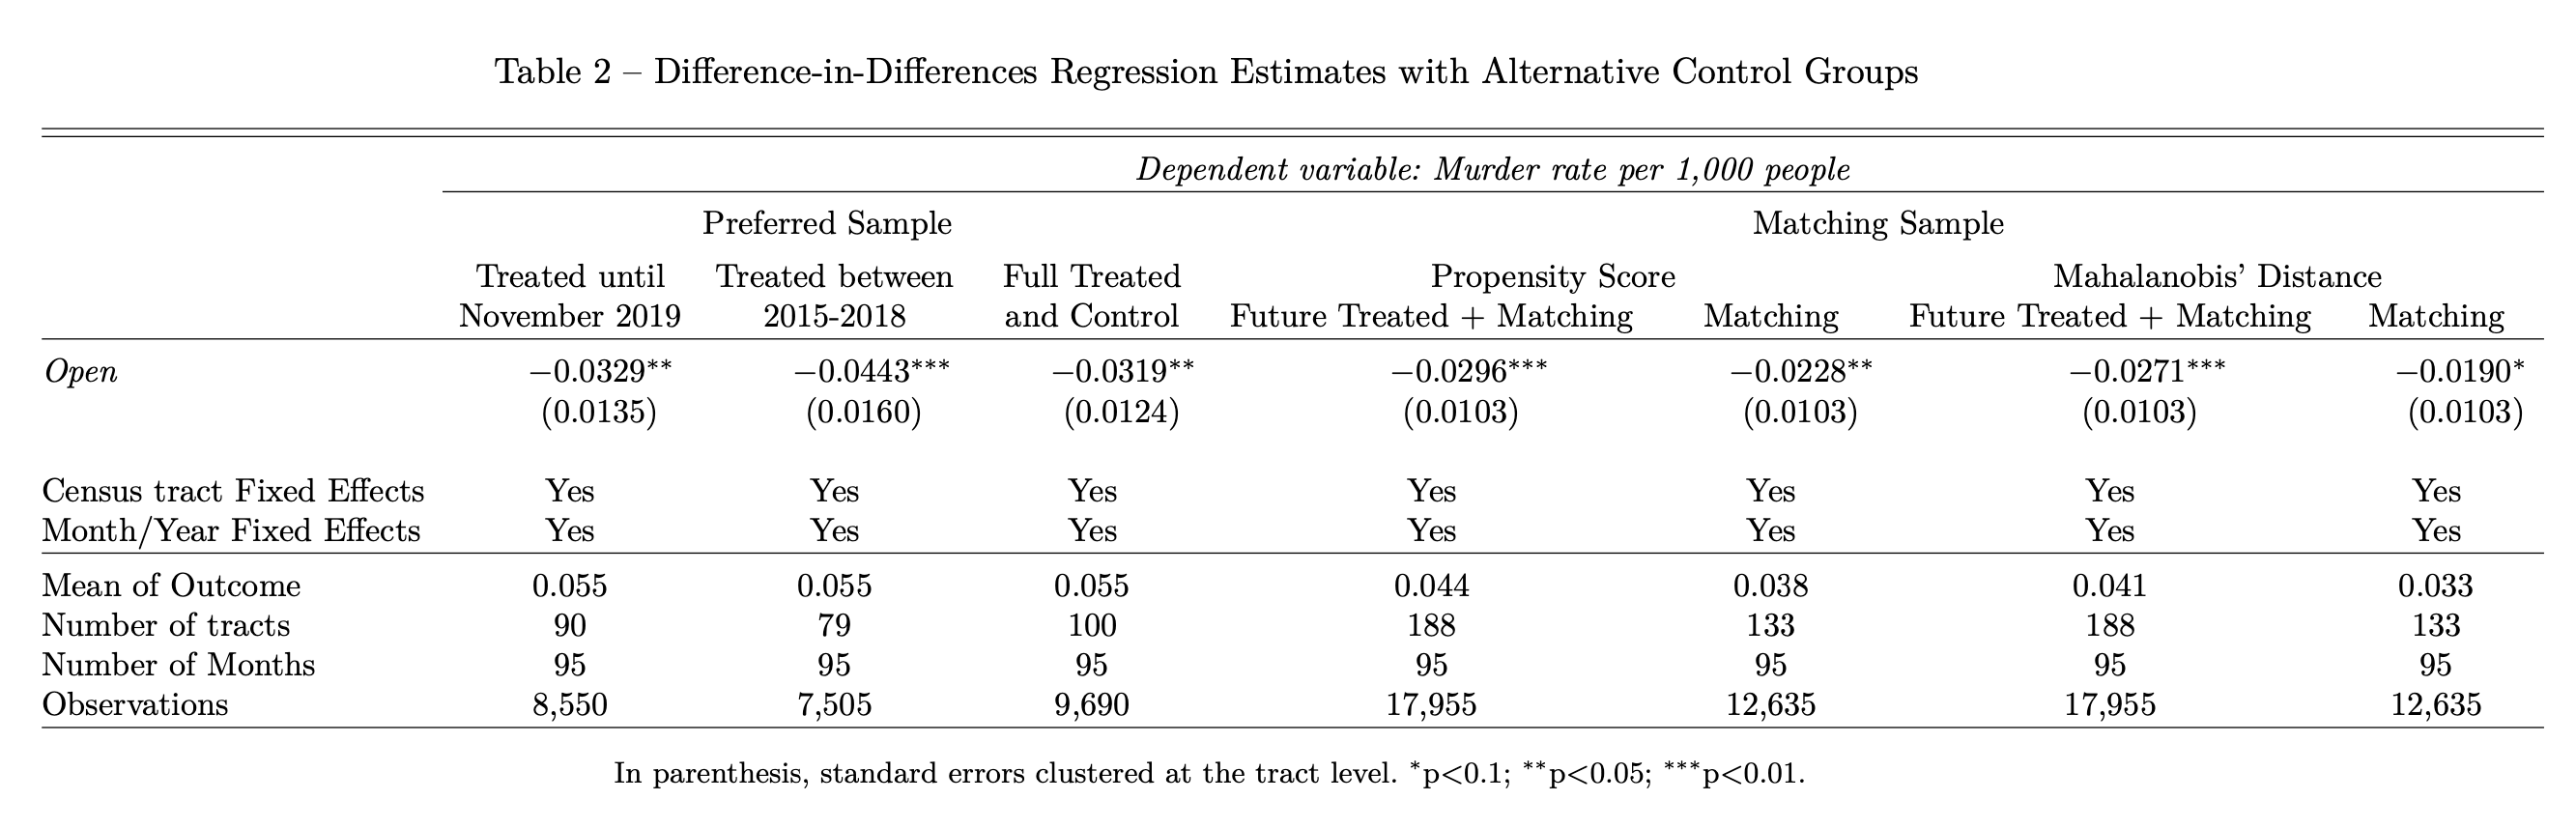
The table shows the results using different sample choices
Point estimates are similar to the ones using the preferred sample and show that results are not driven by neither treated areas at the begging nor the end of the program
Online Appendix contains results from different control group choices using matching. Results are fairly similar across different samples and point to average murder rates reductions between 57% and 67%
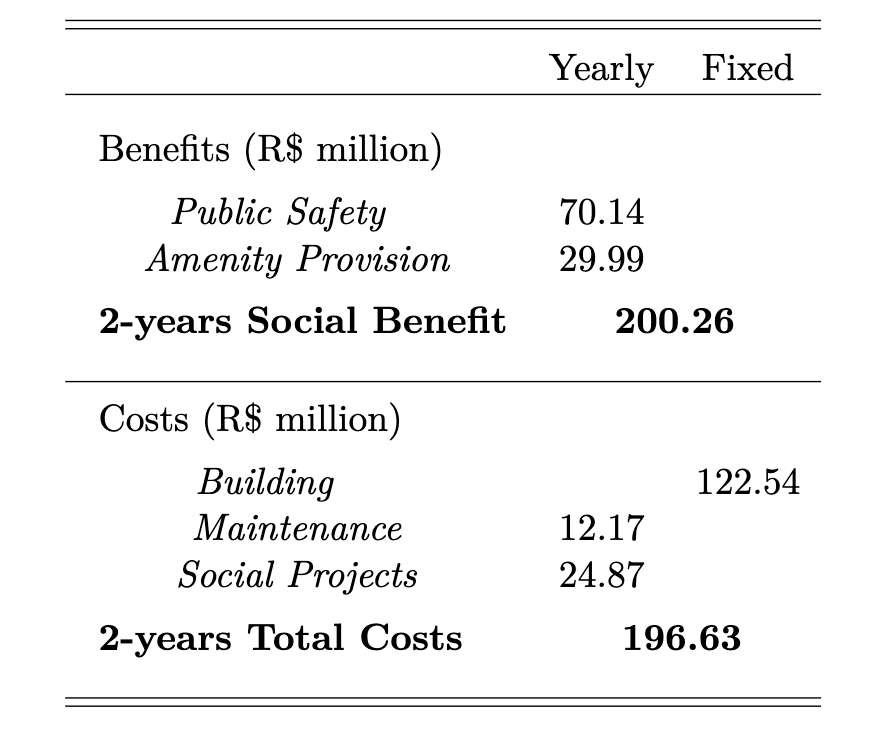
Cost-Benefit Analysis
Back-of-envelop calculation shows that the 31 treated areas are having 18.86 fewer homicides every year. Extrapolating the effects to all 102 areas covered by 103 football fields, there are 62.68 fewer murders/year due to this policy. I follow Pereira, Almeida and Oliveira (2020), who attach R$ 1.119 million for a blue-collar Brazilian men
Amenity value is based on private turf field rentals at an hourly rate of R$ 100, considering 56 hours/week available for practice
Building costs vary from R$ .24 to R$ 1.7 million depending on the type of the equipment, and maintenance costs are composed by salaries, water and energy. There are four social projects connected to areninhas with an estimated cost of R$ 24.87 million/year
Appendix
Time line of Events
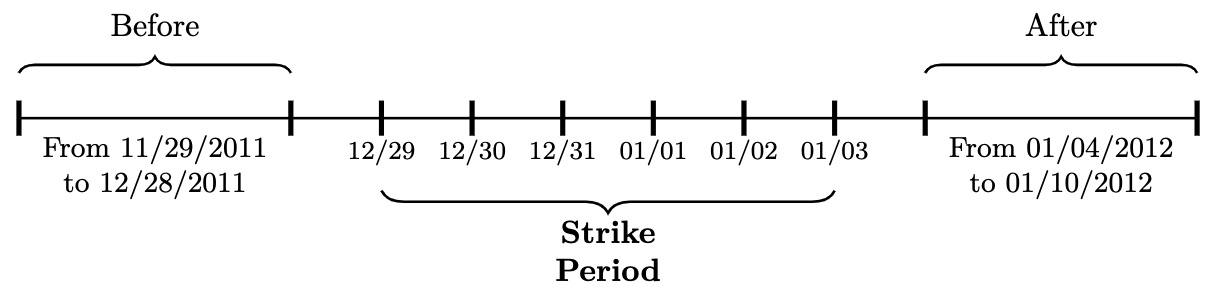
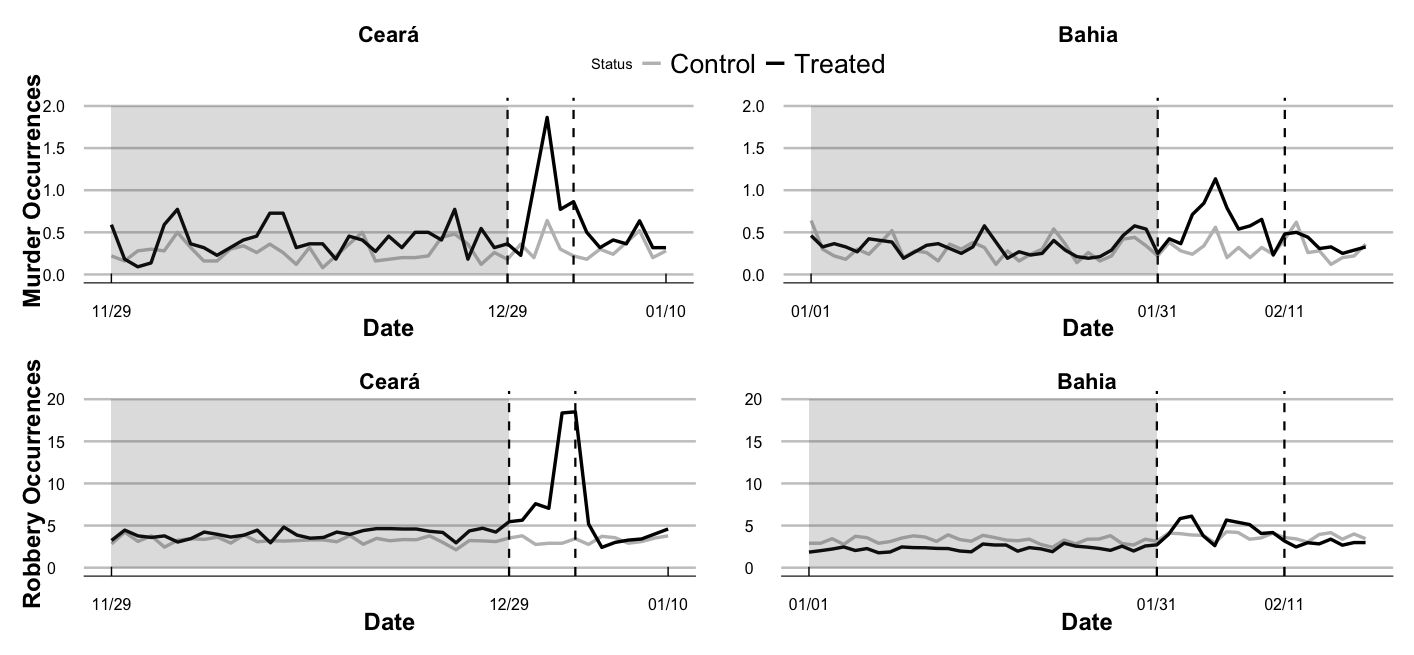
Crime information from November \(29^{th}\), 2011 to January \(10^{th}\), 2012
Comprehends 22 treated SAs (Ceará), and 50 SAs as control - 26 in Pernambuco, 24 in Alagoas
6 days of strike, around 70%-90% decrease in the number of Police officers on the streets
![]()
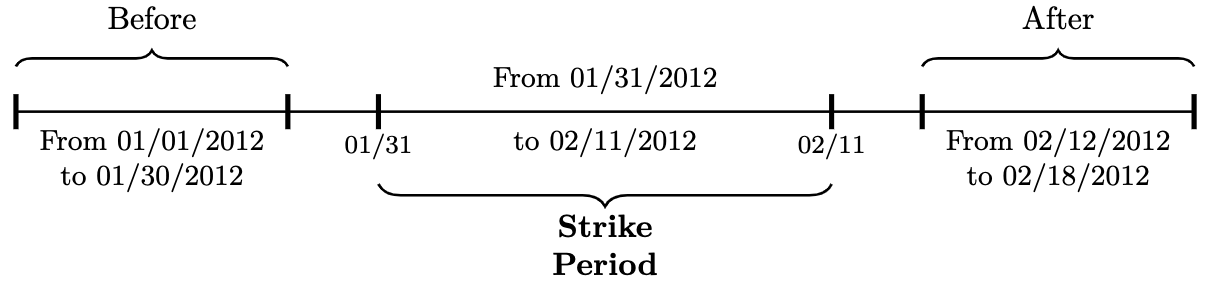
Crime information from January \(1^{st}\), 2012 to February \(18^{th}\), 2012
52 treated SAs in Bahia, and 50 SAs as control (Pernambuco and Alagoas)
12 days of strike, around 33%-50% decrease in the number of Police officers on the streets
![]()
Identification and Estimation I
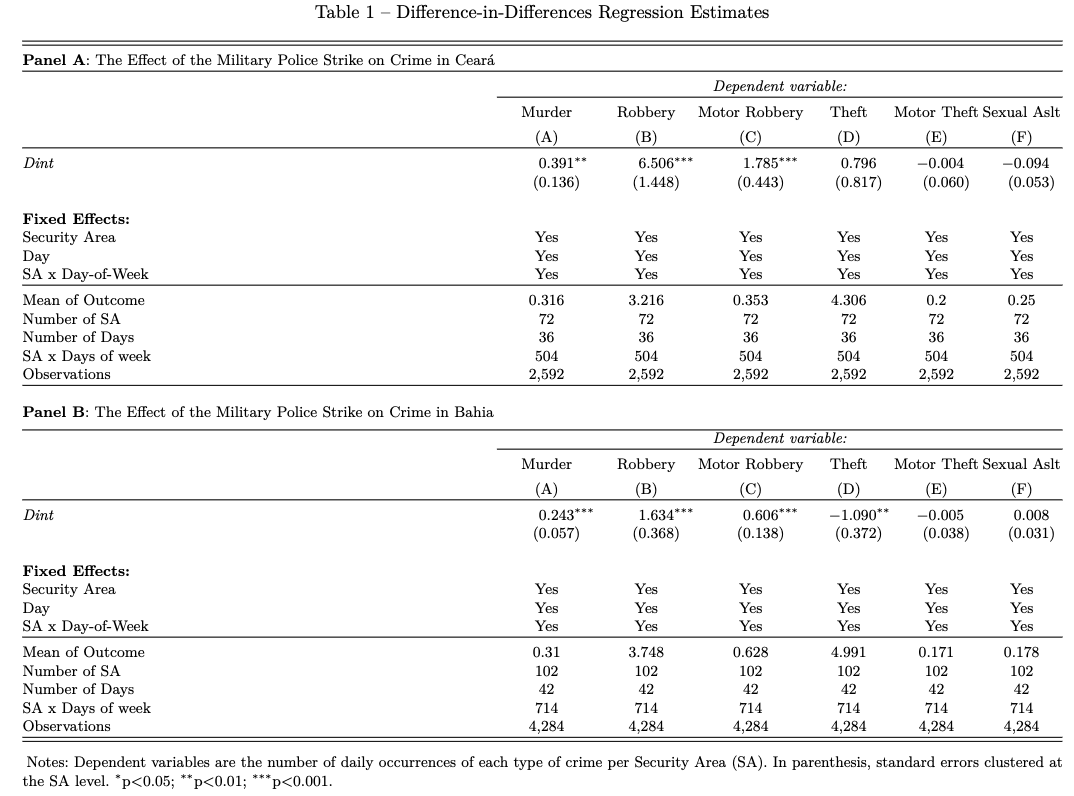
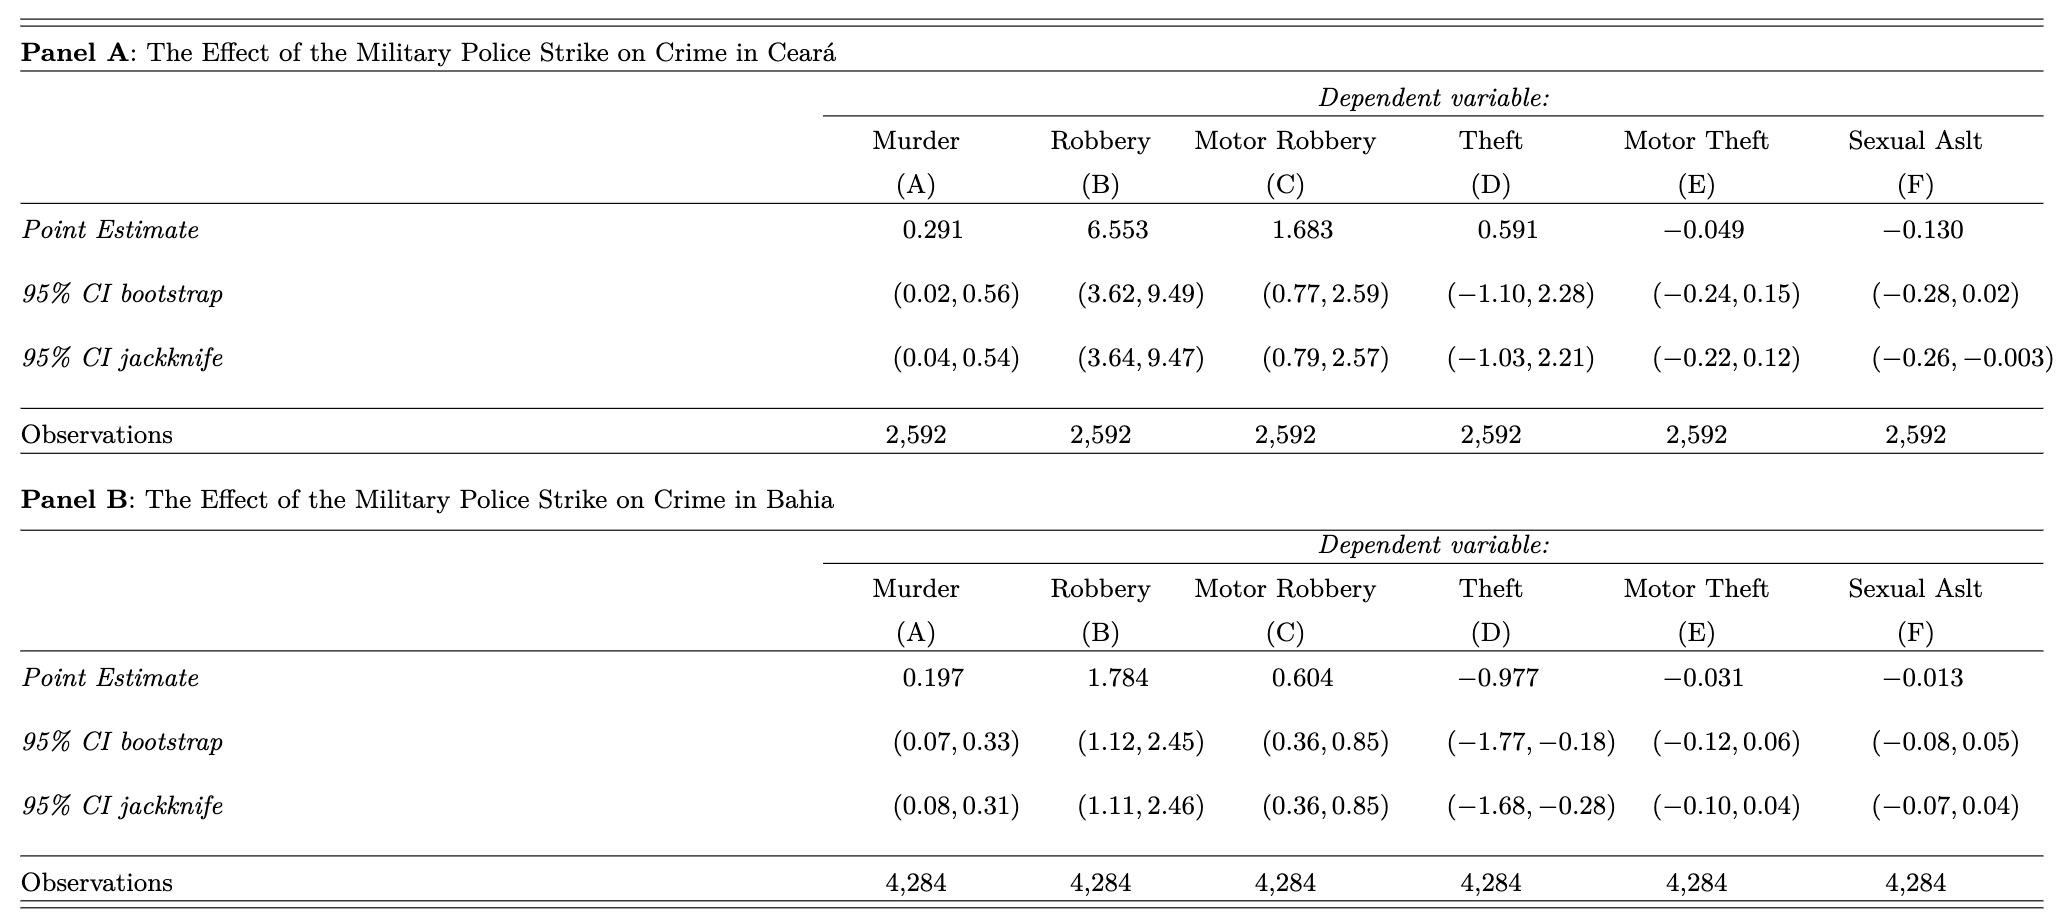
DiD Estimates
Murder increased by 123.7% and 78.38%, while robbery grew by 202.3% and 43.59% in Ceará and Bahia, respectively
There is no reaction of motor theft, but motor robbery increased 5-fold and 96.5% in Ceará and Bahia, respectively
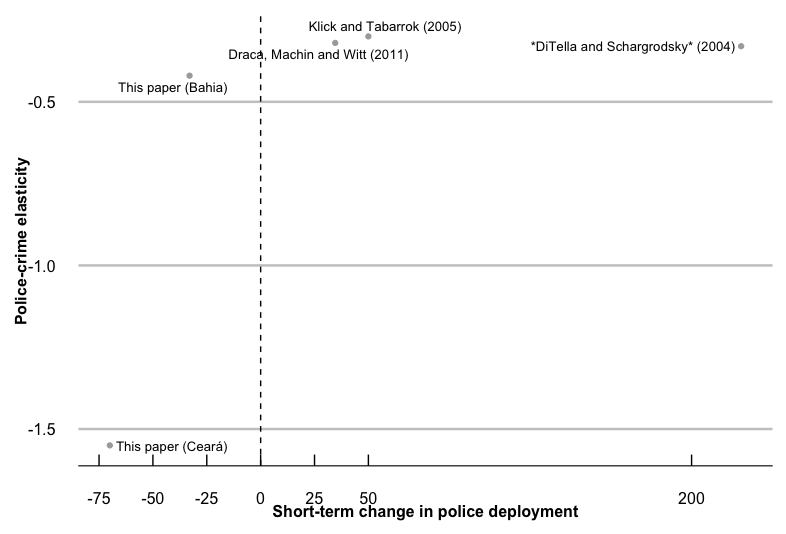
Murder and robbery elasticities range from [-1.56, -1.37] and [-2.24,-0.87]
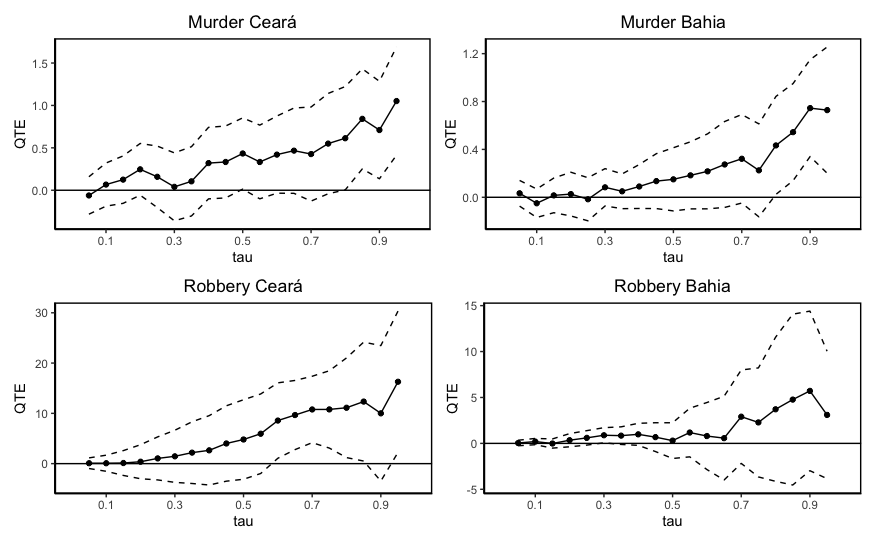
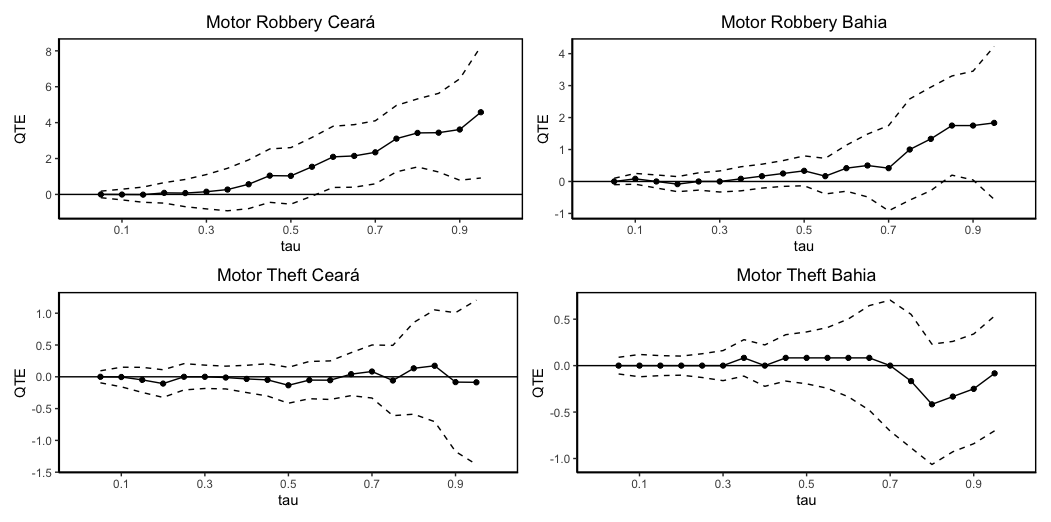
QDiD Estimates
There are more cops allocated in the capital and metro area
Crime concentrates in few security areas
Treatment effects are much higher at upper percentiles
Takeaways
Violent crimes have a huge cost to society and this paper shows the essential role of deterrent effect on crime when police patrolling levels are low
- In particular, criminals switch to violent methods when \(p_{j}\) was very low
Time dynamics show perceived risk of arrest matched reality as time passed
Large elasticities associated to fewer cops suggest non-linear effects of police presence on crime
Appendix
Data and Context
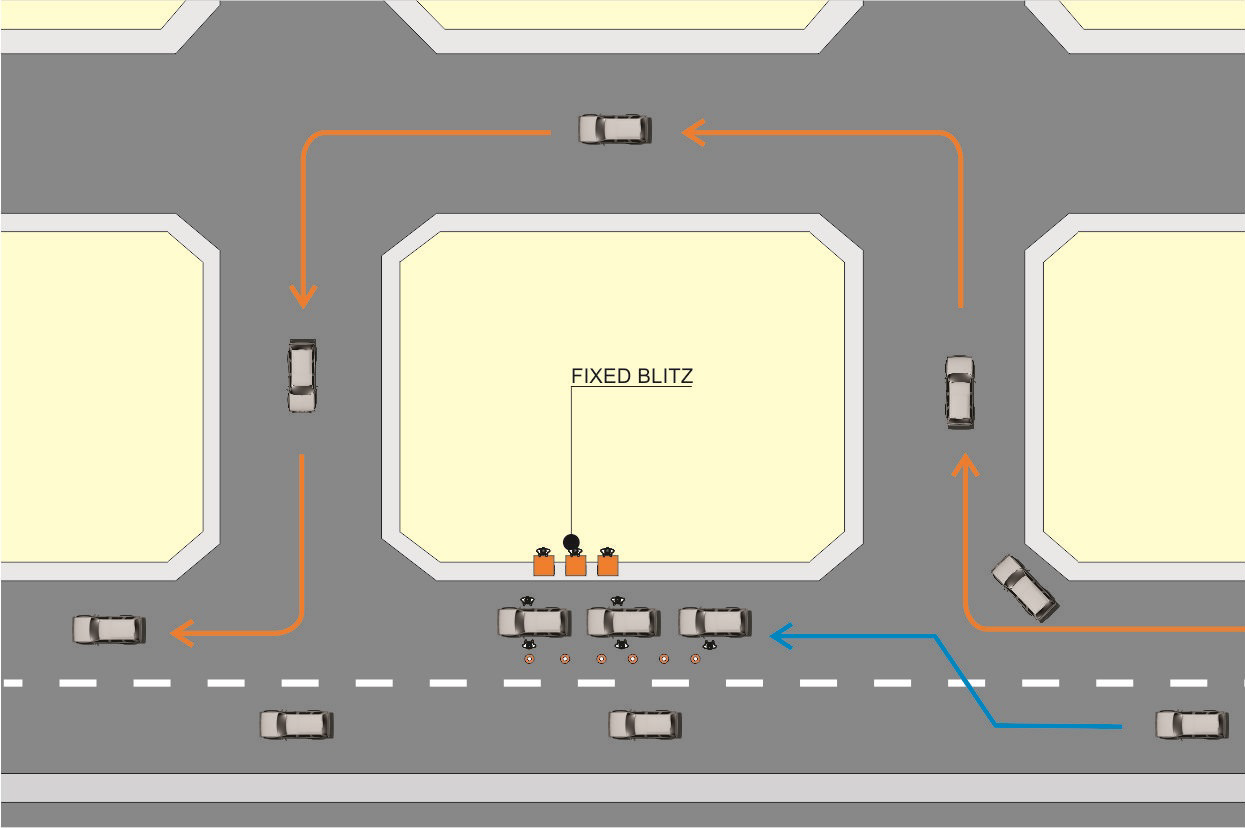
Police Blitzes
2004 identified blitzes in 450 census tracts over 52 weeks of 2012
Crime data
Violent crimes (homicide, robbery and bodily injury) at census tract level
Fortaleza’s socioeconomic profile (Census 2010)
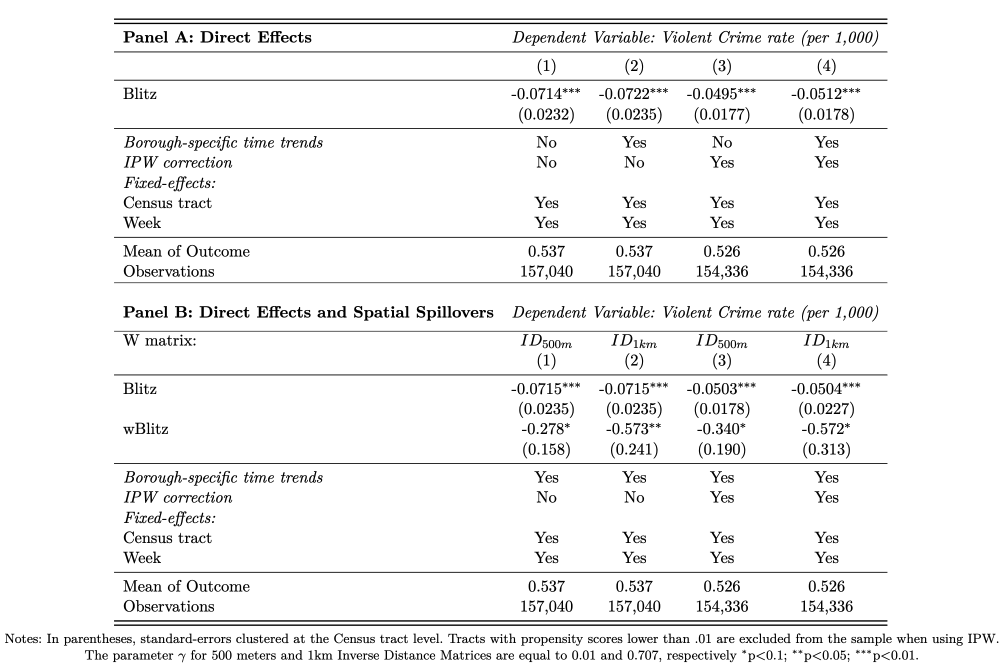
Results
Direct effects of local police interventions range from 9.41 to 13.3%. Indirect effects are around 2.61-5.82%
The interpretation of the \(wBlitz\) coefficient is not straightforward. One needs to take into account that it represents the average number of blitzes in the neighborhood at a certain cutoff
- Within 500m, an average census tract has 11.1 neighbors, and at 1km cutoff that number increases to 41.6.