Neighborhood Intervention, Crime and School Achievement
2/1/23
The Areninhas Project
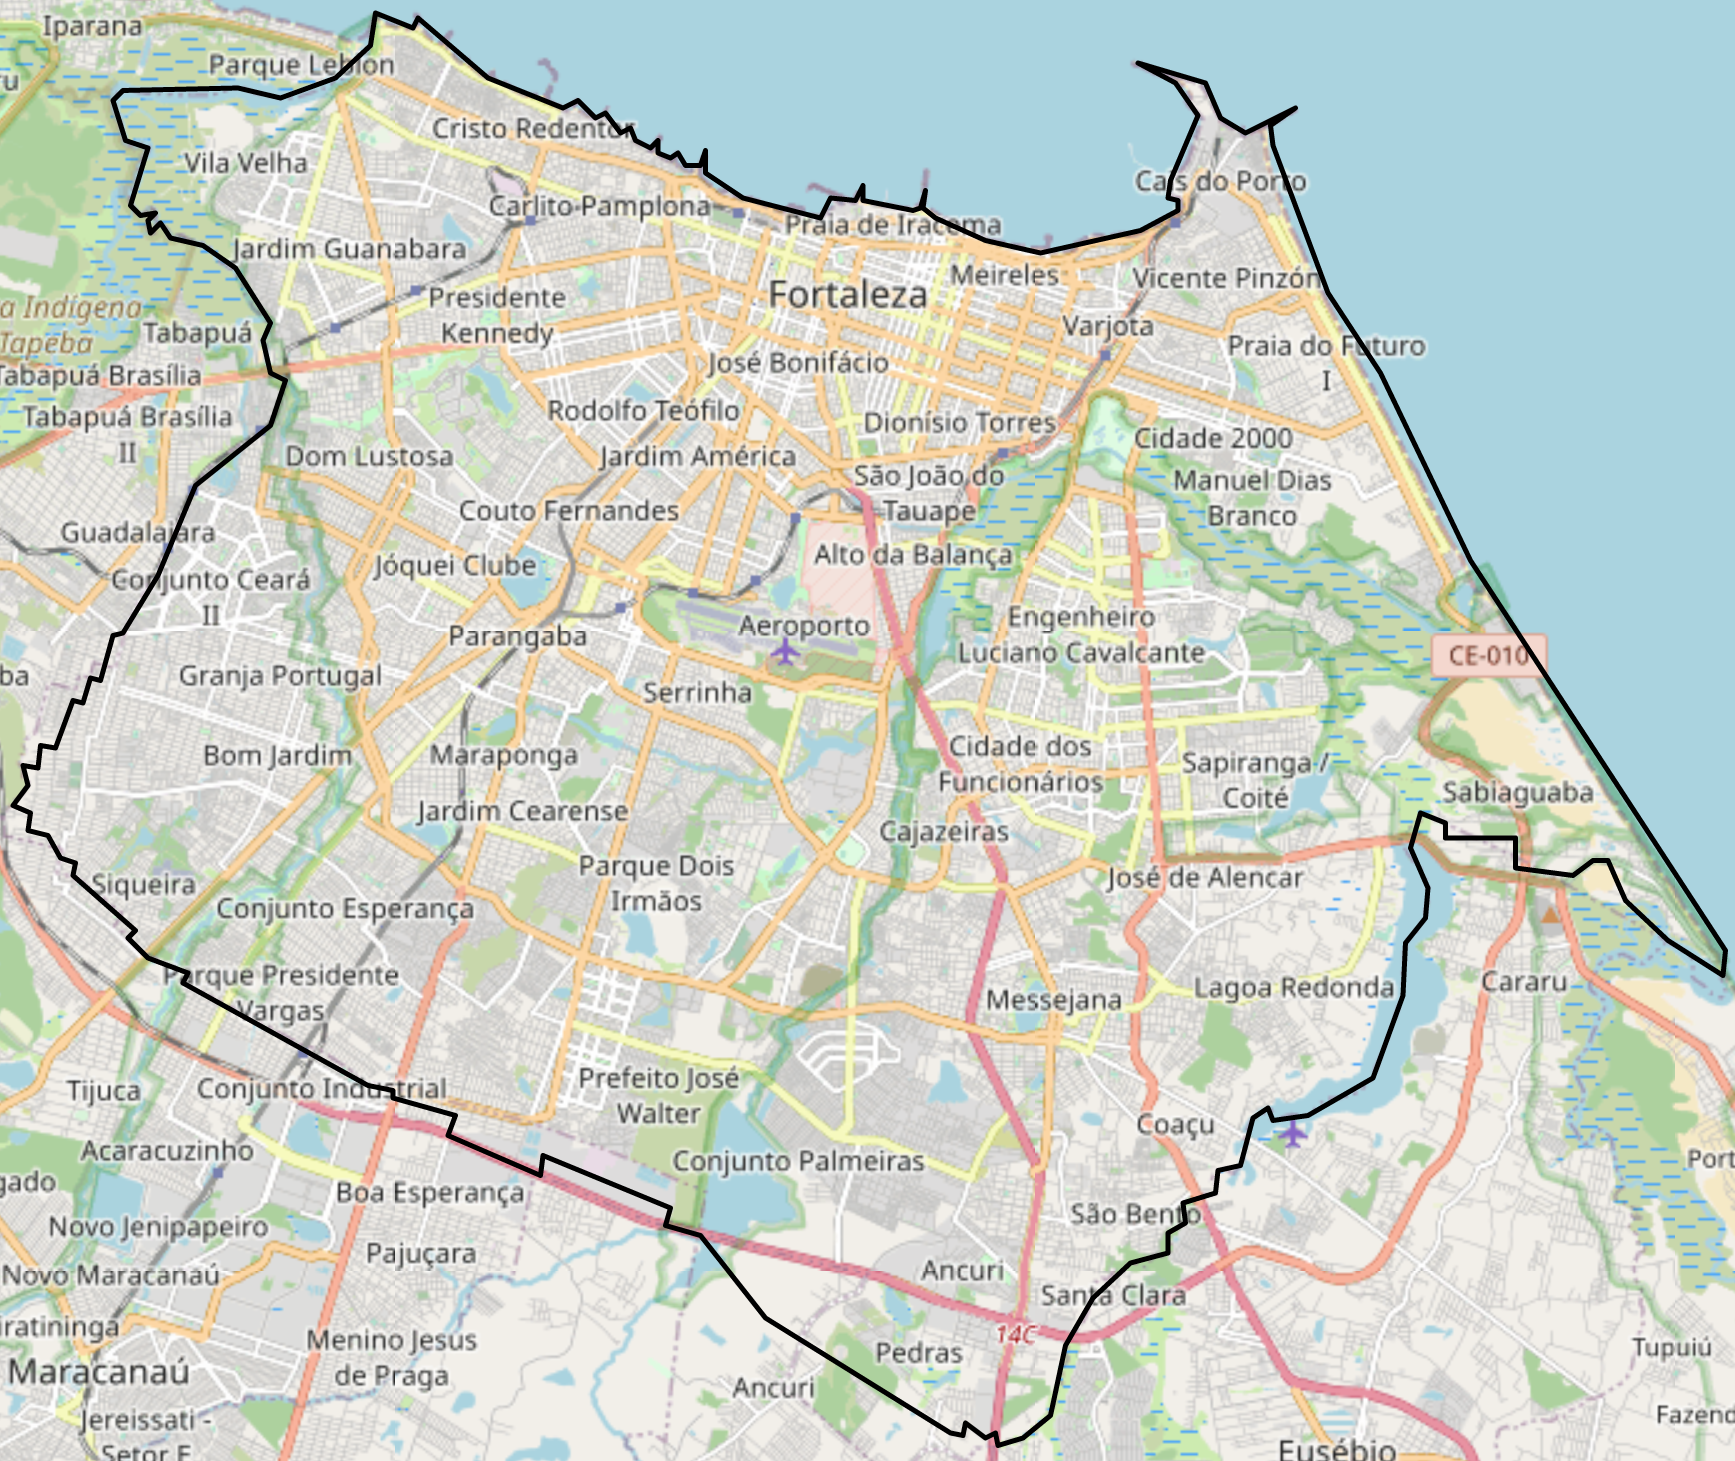
Fortaleza is the fifth largest Brazilian city and is the state capital of Ceará, located in the Northeast region of the country
The city has 120.6 sq mi of territorial area and population around 2.7 million - similar to Houston and Chicago
- From 2010 to 2020, Fortaleza’s population grew by 10%
The metropolitan area accommodates 4.5 million people
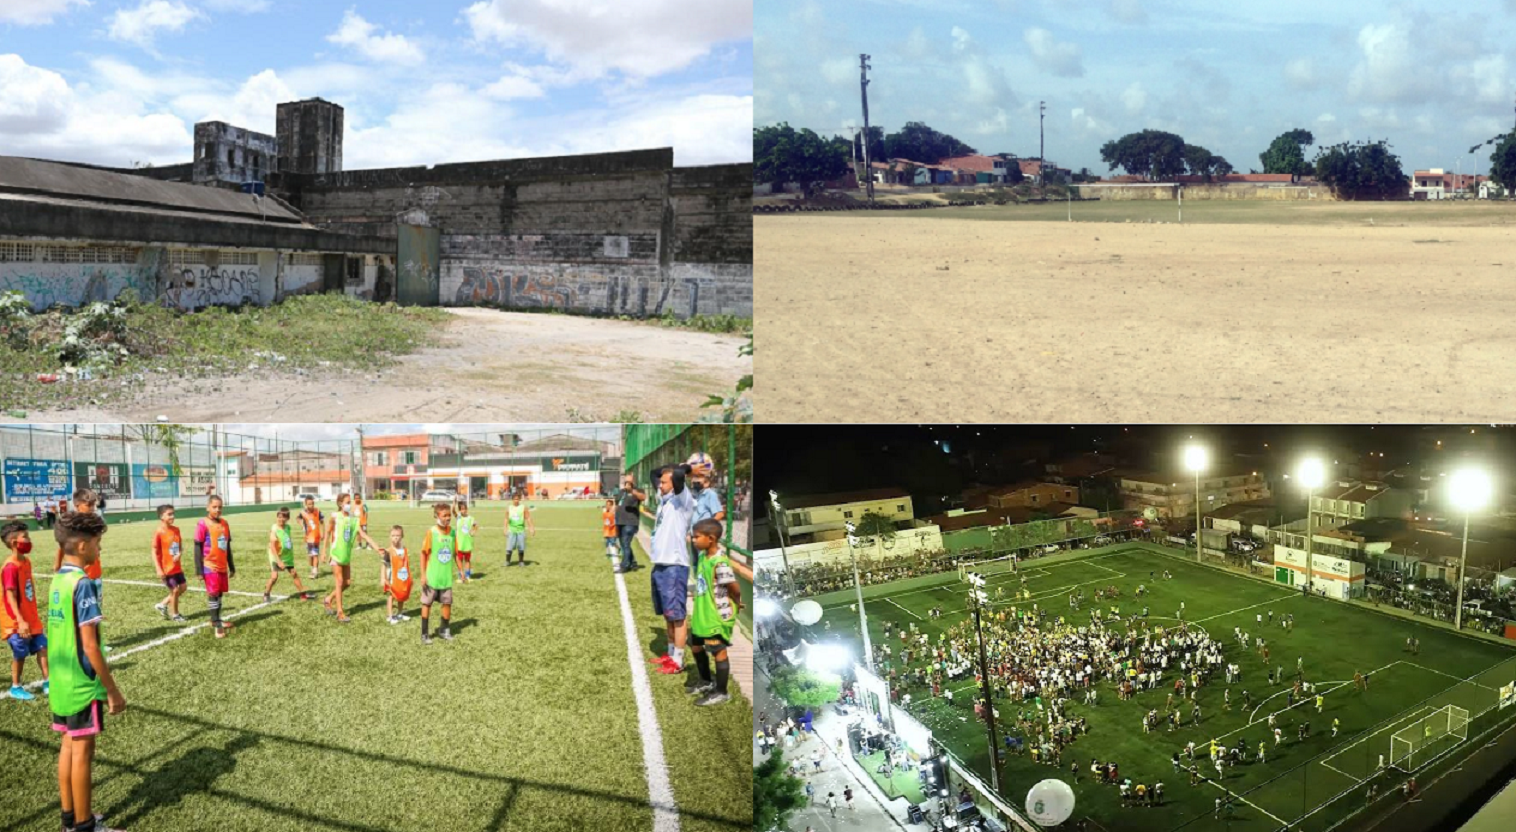
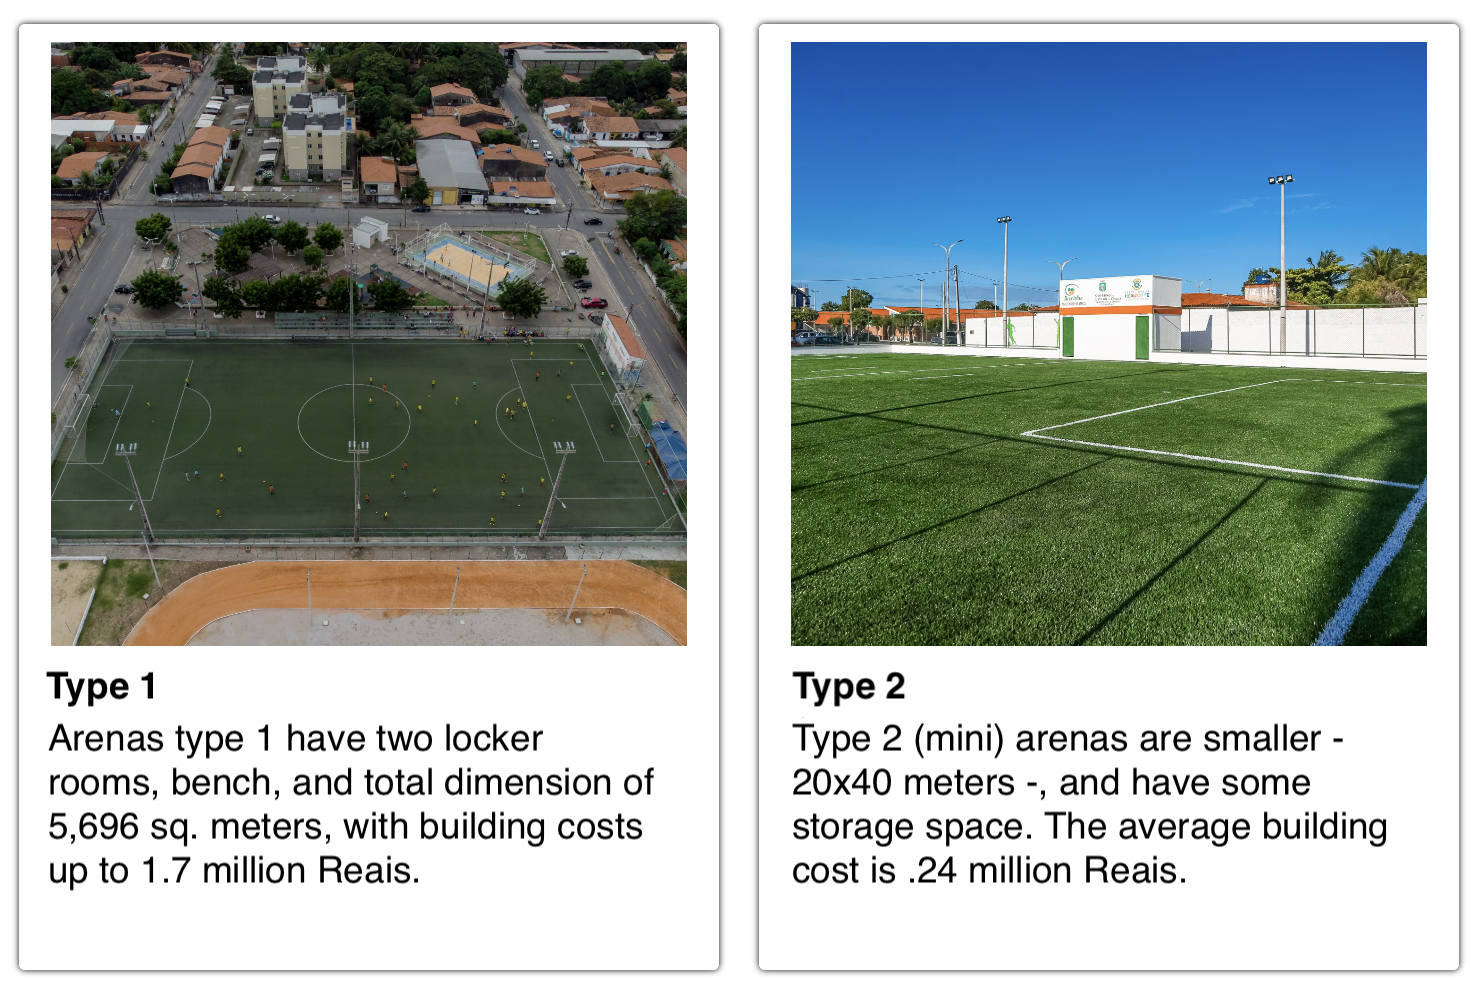
In July 2014, The City of Fortaleza began an ongoing urban renewal project called “Areninhas.” The intervention consists of synthetic football turf, a playground and an outdoor gym. The surroundings are improved with new pavement and substantial increase in street lighting
The project targets vulnerable communities, and the City Hall works with residents to supervise and conserve the public good
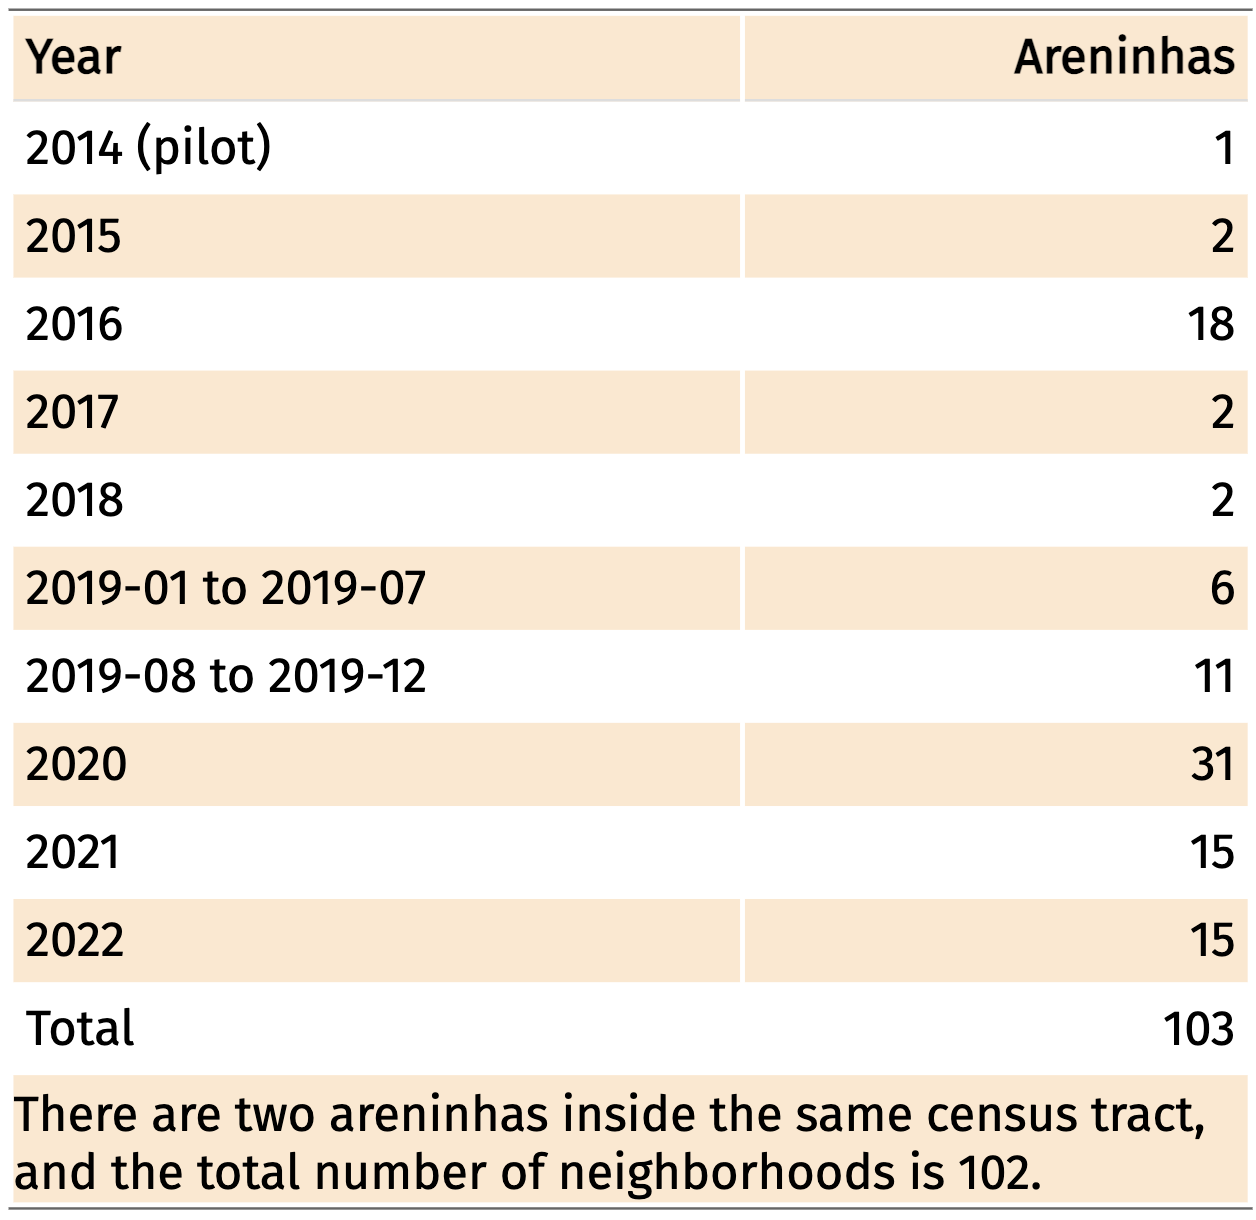
In 8 years, 103 football arenas were built in Fortaleza and more than 150 in the rest of the State
There are two types of equipment - Areninhas type 1 and 2. They differ by the size of the turf field and presence of locker rooms and bench
Each equipment have three employees. Two guards (one in the morning, one in the evening) control access to the fields, and one janitor cleans and organizes the place.
According to the City Hall, maintenance costs (salaries, energy and water) range from R$ 120,000 to 125,000/year.
Free football lessons are offered to the young locals through Monday to Friday
City Hall and State Government invest R$ 24.87 millions/year in four social projects: Esporte em 3 tempos, Futpaz, Esporte superação, and Atleta Cidadão
Projects directly impacts around 32,000 children
Amateur football championships are held on weekends, an pick-up football games happen at daily basis

Data and Context
Fortaleza-CE commonly ranks as one of the most violent cities in the world, with homicide rates close to Cali-COL, St Louis-USA and Baltimore-USA.
Between 2004 and 2015, the homicide rate in Fortaleza tripled, and, since 2012, the city is usually listed in the top 3 among Brazilian big cities in homicide rates
Detailed information about 12,081 murders within Fortaleza’s boundaries between January 1st, 2012 and November 30th, 2019
The 8,291 homicides that happened on the streets are considered in the analysis
5,560 murders occurred between 8:00 am and 10:00 pm
Murders are aggregated to months and at the census tract level. The outcome is homicide rates per 1,000 people
Note: complete addresses were converted to coordinates (lat and lon) using Google’s API
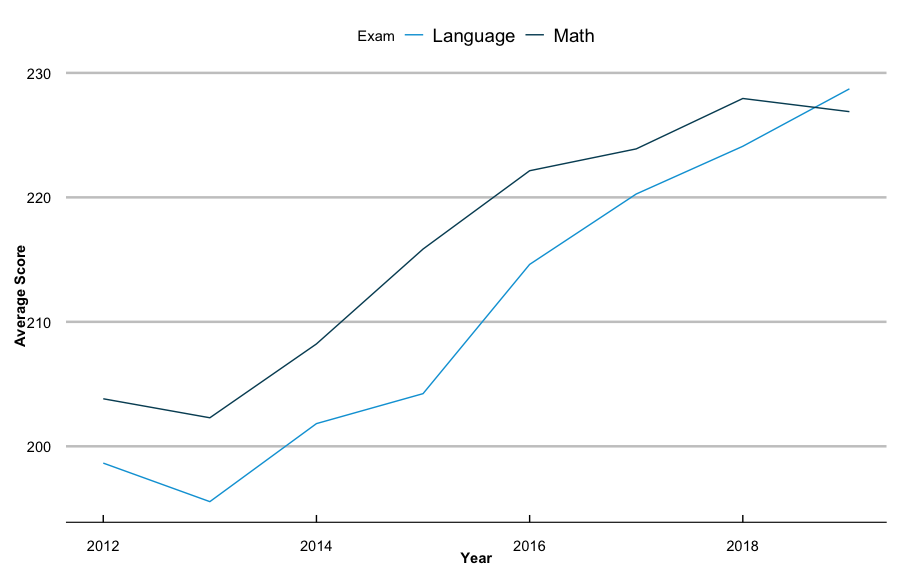
Since 1992, the State Government of Ceara has been consistently evaluating the performance of students in the public system. Every year, middle and high school students take the SPAECE exam by late November
The SPAECE contains standardized Math and Portuguese test scores - it is an average at the school level
School Census data have yearly information about schools’ characteristics (internet coverage, presence of labs/library, number of employees, etc.)
Fortaleza is divided into 3,020 census tracts with non-zero population, and an average tract contains 812 people and have .04 sq mi total area (2010 Census)
Crime results at the census tract level
- Displacement areas are based on the distance of the equipment to the tract’s centroid
Student achievement results are based on the distance from the equipment to schools
Research Design - Murders
The Local Government assigned treatment to neighborhoods with very-low/low HDI
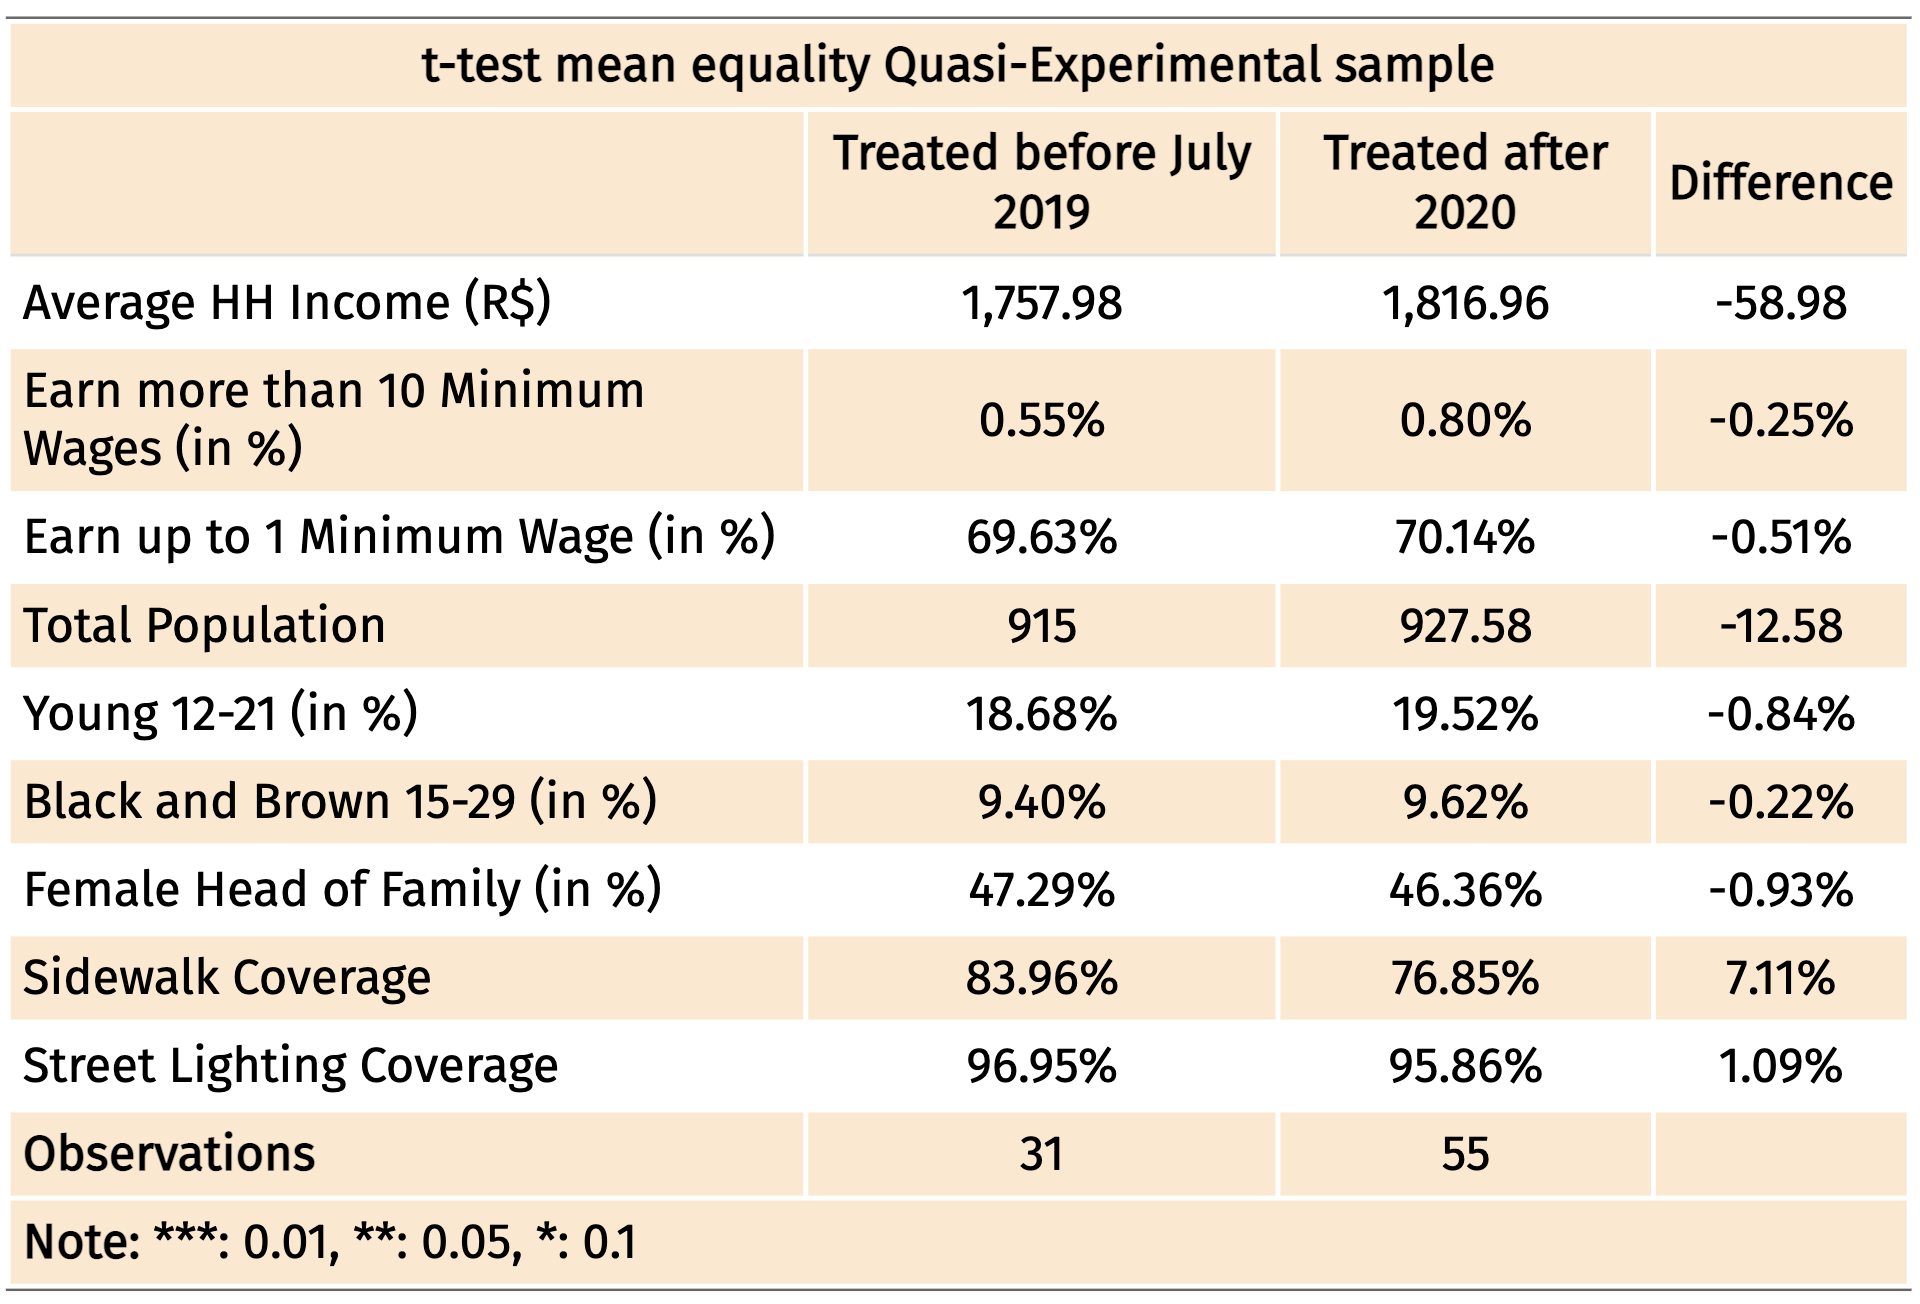
I conjecture tracts treated until July 2019 and after January 2020 are similar in observables and unobservables, and this control group’s choice produces an apples-to-apples comparison
Potential control areas within 650 meters of a treated neighborhood are excluded (2), as well as fields built between September and December 2019 (11)
In total, there are 31 treated and 55 control neighborhoods
Total population in treated areas is 28,365 and in control tracts is 51,017
This sample covers 3.2% of the city’s population and around 6% of land area
TWFE
The causal effect of the neighborhood intervention is estimated using the following:
\[\text{Murder Rate}_{im}=\lambda_{m}+\gamma_{i}+\beta Open_{im}+\varepsilon_{im}\text{ } \text{ } \text{ }\text{ }\text{ } (1)\]
where \(\lambda_{q}\) is the time fixed effects (month-year), and \(\gamma_{i}\) refers to census tract fixed effects. \(\beta\) is the difference-in-differences estimate that captures the causal effect of interest: the extent to which the treated and non-treated city blocks differ in their homicide rates after the urban renewal policy
TWFE with Time-of-day heterogeneity
To check whether this urban intervention have different effects within hours of day, I consider the following:
\[\text{Murder Rate}_{iqt}=\lambda_{mt}+\gamma_{i} +\beta_{1}Open:Morning_{imt}+\beta_{2}Open:Afternoon_{imt}+\beta_{3}Open:Night_{imt}+\varepsilon_{imt}\text{ } \text{ } \text{ }\text{ }\text{ } (2)\]
where \(\lambda_{mt}\) represents month-year-time-of-day fixed effects. The morning covers the hours from 8 to 11:59 am, afternoon 12:00 pm until 5:59 pm, and night 6:00 pm to 9:59 pm. The omitted category is ‘closed,’ covering the hours from 10:00 pm to 7:59 am.
TWFE splitting the sample: Day-of-week, Age, Gender, and Criminal record heterogeneity
To estimate gender, day-of-week, age and criminal record-specific effects, I consider the following:
\[\text{Murder Rate}^{j}_{im}=\lambda_{m}+\gamma_{i}+\beta Open_{im}+\varepsilon_{im} \text{ } \text{ } \text{ }\text{ }\text{ }(3)\]
where \(\text{Murder Rate}^{j}_{im}\) is the outcome measured in tract \(i\) for deceased individuals of gender/of age/with criminal-record/at day-of-week \(j\) in month \(m\).
Results Crime I
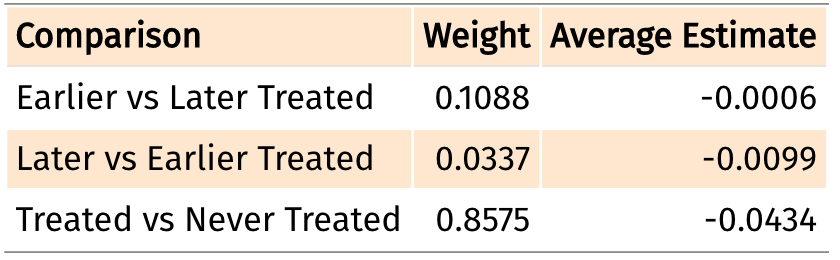
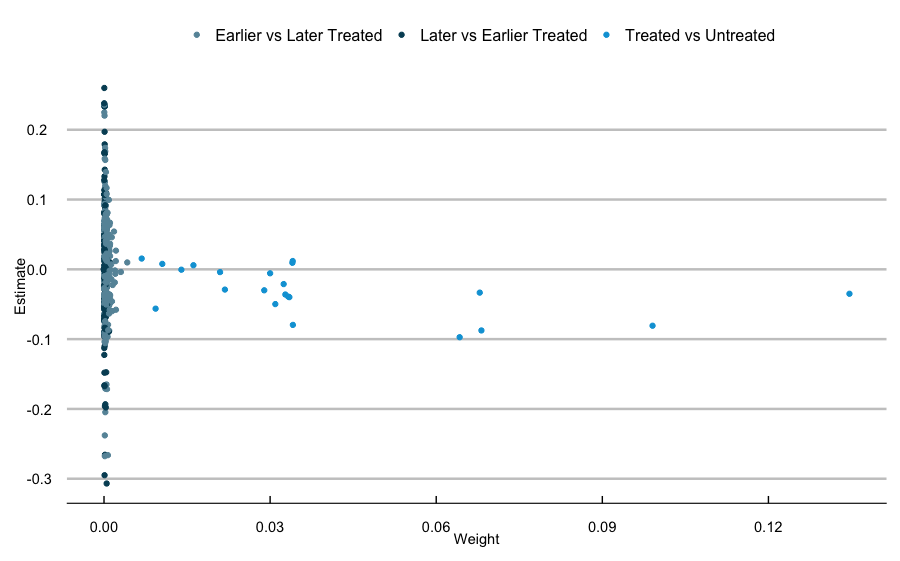
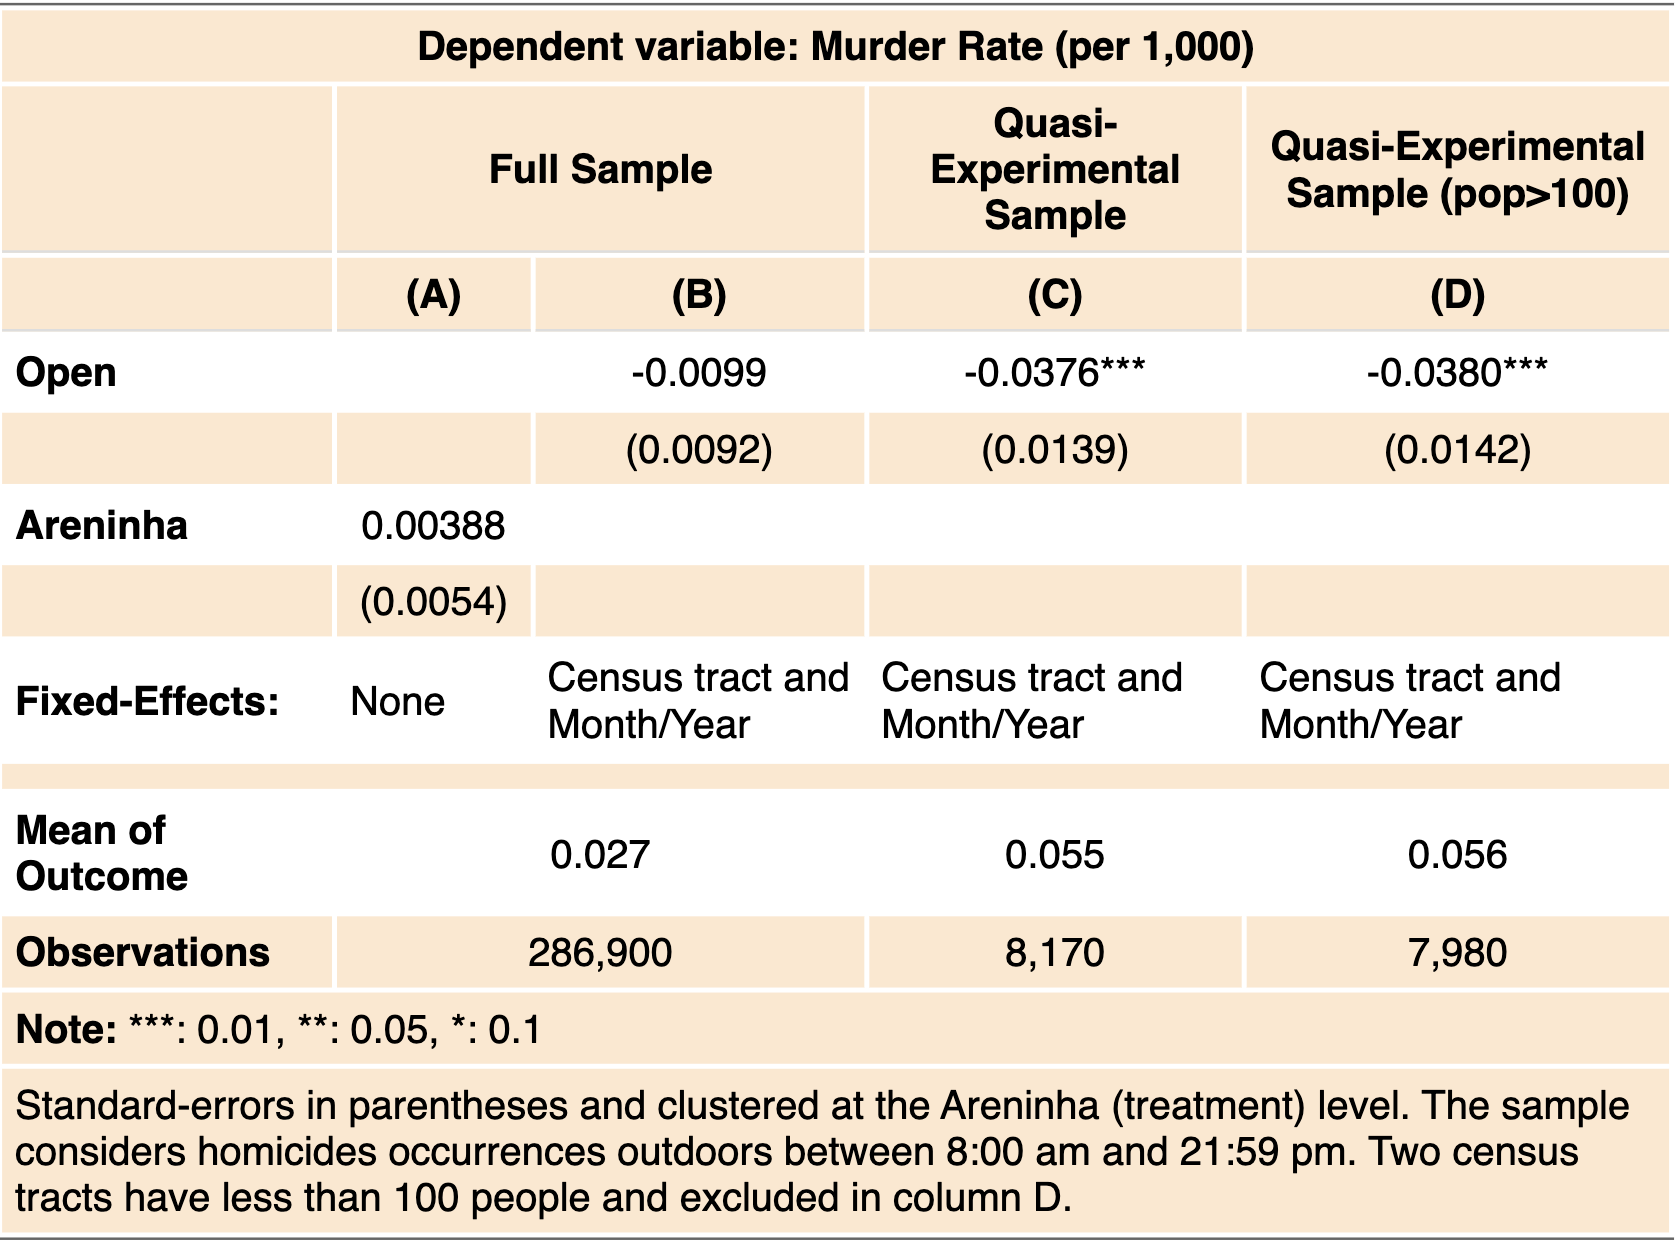
(A) shows a naive comparison of murder rates between treated census tracts and the rest of the city. (B) still uses full sample, but exploits the staggered rollout of the urban policy
(C) and (D) use the quasi-experimental sample. Results are precise and statistically significant: the urban renewal policy caused a decrease in murder rates around 68% in treated neighborhoods
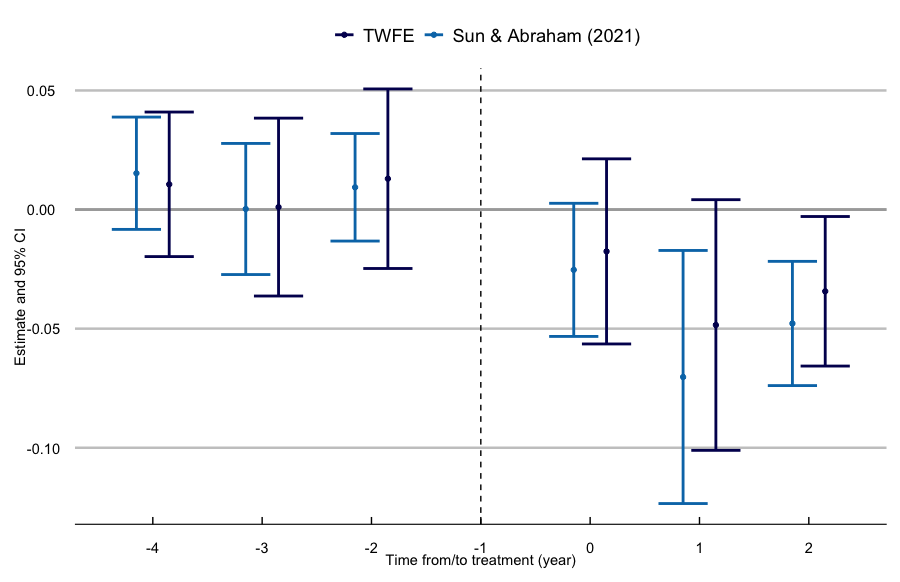
Dynamic treatment effects are estimated by
\[\small\text{Murder Rate}_{im}=\lambda_{m}+\gamma_{i}+\sum_{\tau=-4, \tau \neq -1}^{2}\beta_{\tau} Open_{i\tau}+\varepsilon_{im}\]
where months are binned to years, and endpoints are also binned at -4 (or less) and 2 (or more). Coefficients are normalized to event time -1
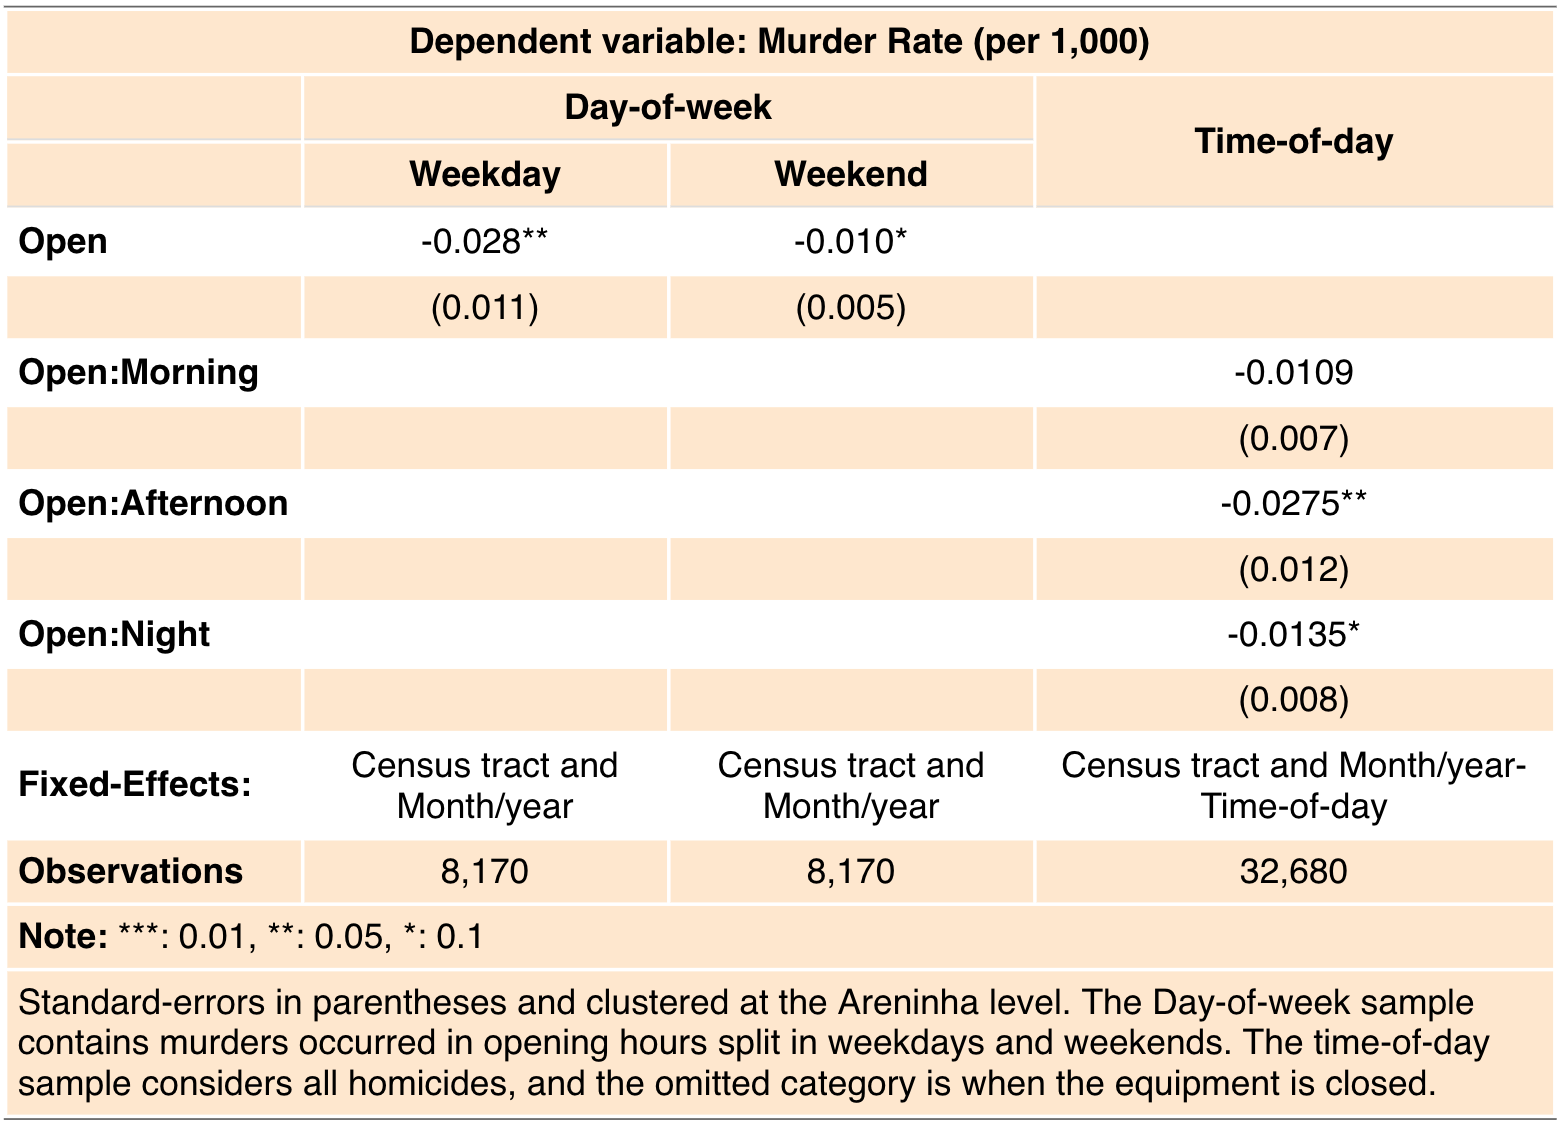
Day-of-week columns show a larger effect during weekdays, when social projects happen. Time-of-day analysis points to a bigger effect during the afternoon (from 12 pm to 5:59 pm)
Pupils that study during the afternoon and commute from home to school around 1:00 pm and from school to home between 5:00-5:30 pm would benefit the most
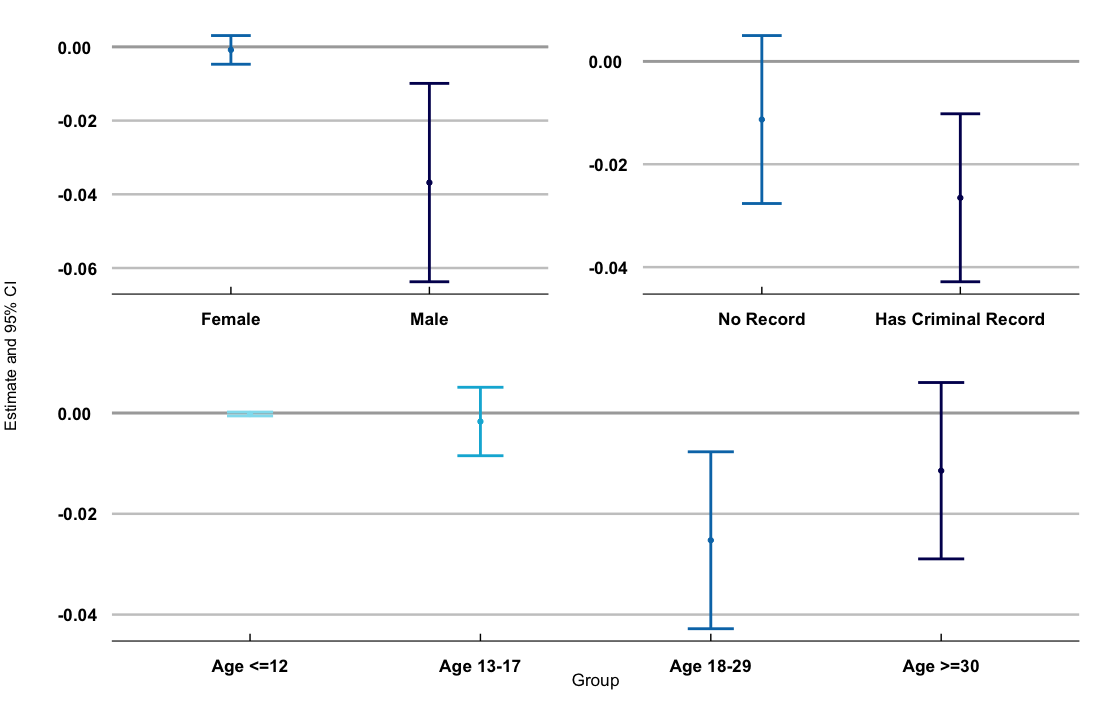
The effect is driven by males aged 18-29 with past criminal record
Although there is anecdotal evidence of young males leaving the drug trafficking in these areas, incapacitation effect is hard to identify. Most likely, the mechanism is fewer gang fights in treated areas
Results Crime II
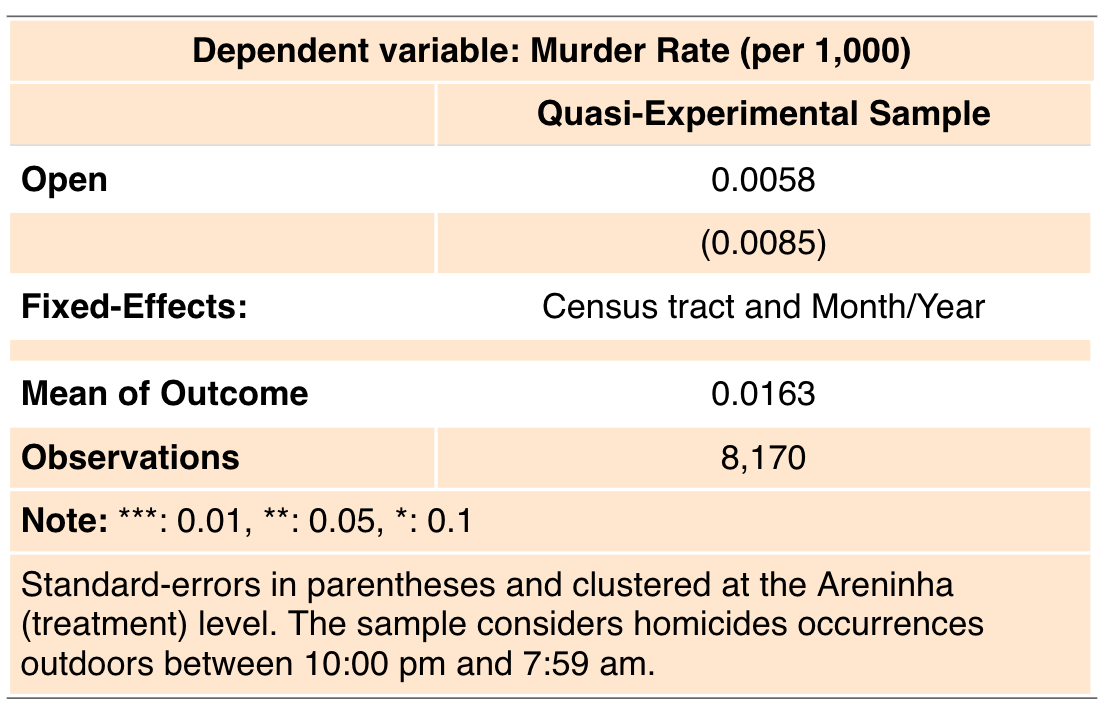
Temporal displacement is estimated using equation (1) but with murders happening during closed hours - from 22:01 pm to 6:59 am
Point estimate suggests an increase around 35% in homicide rates, but it is not statistically significant at usual levels (p-val=.49)
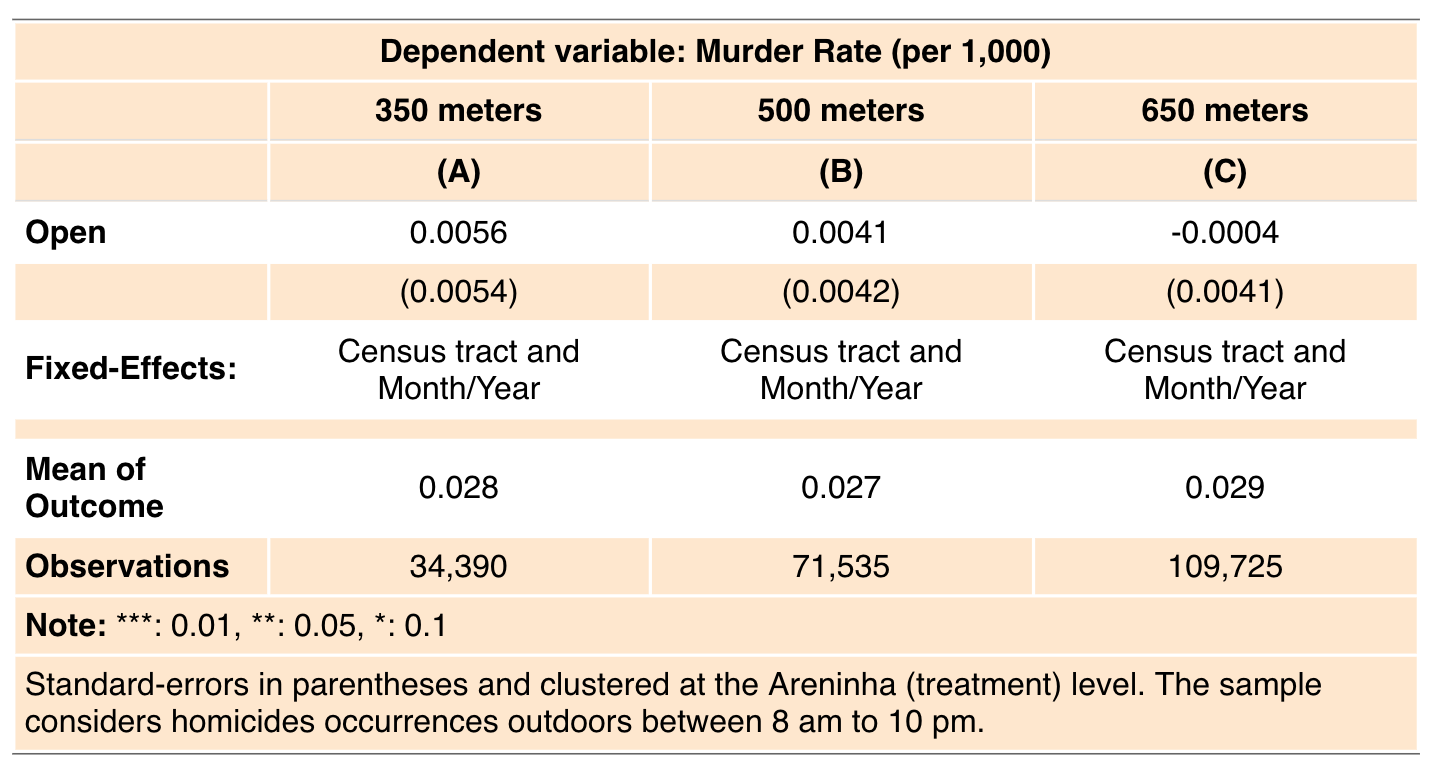
Neighborhoods are built around treated census tracts using the equipment’s distance to the other tracts’ centroids. The homicide data covers the opening hours
Point estimates are not statistically significant, and there is no evidence of crime moving around corners
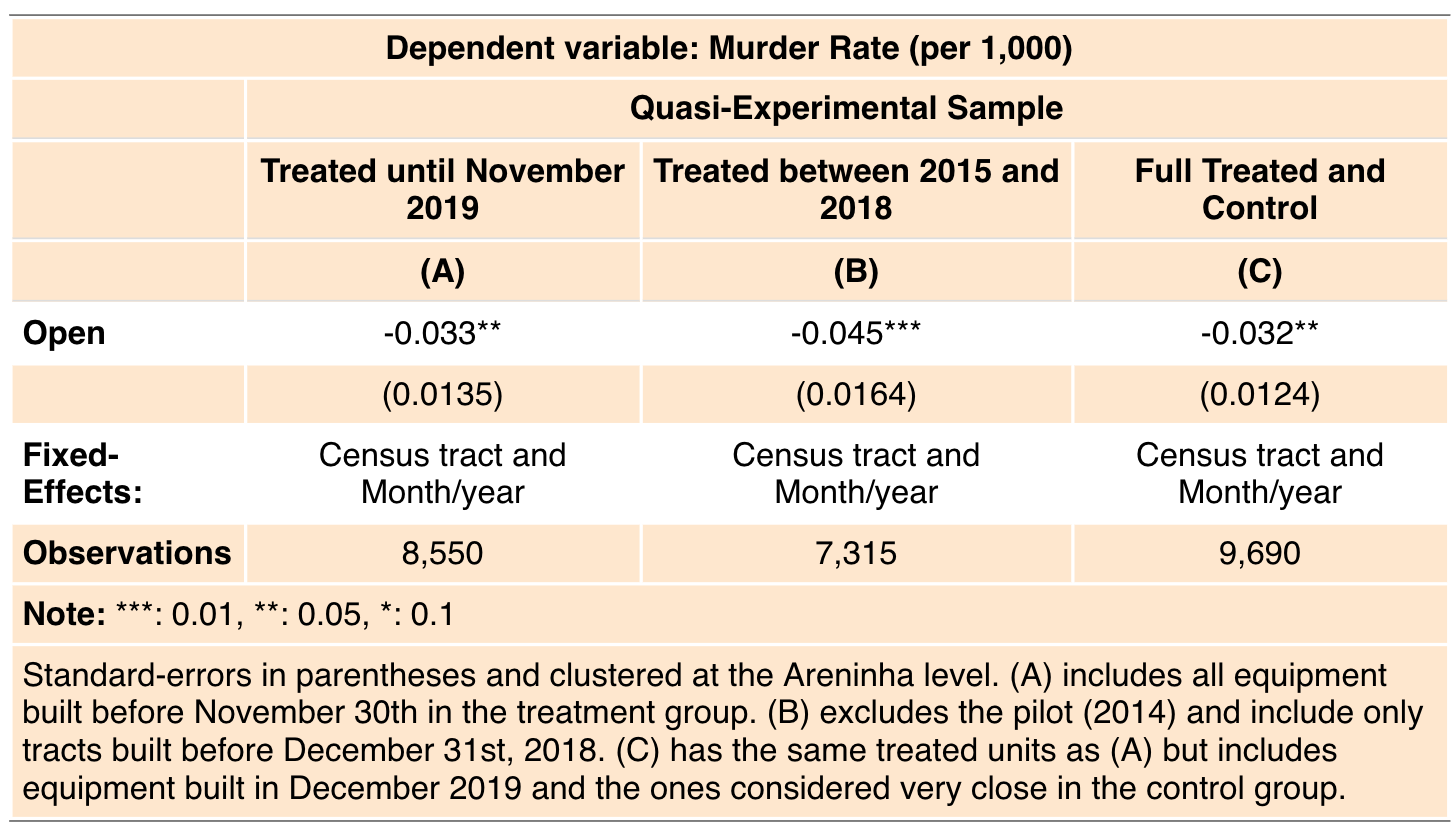
The table shows the results using different sample choices
Point estimates are similar to the ones using the preferred sample and show that results are not driven by neither treated areas at the begging nor the end of the program
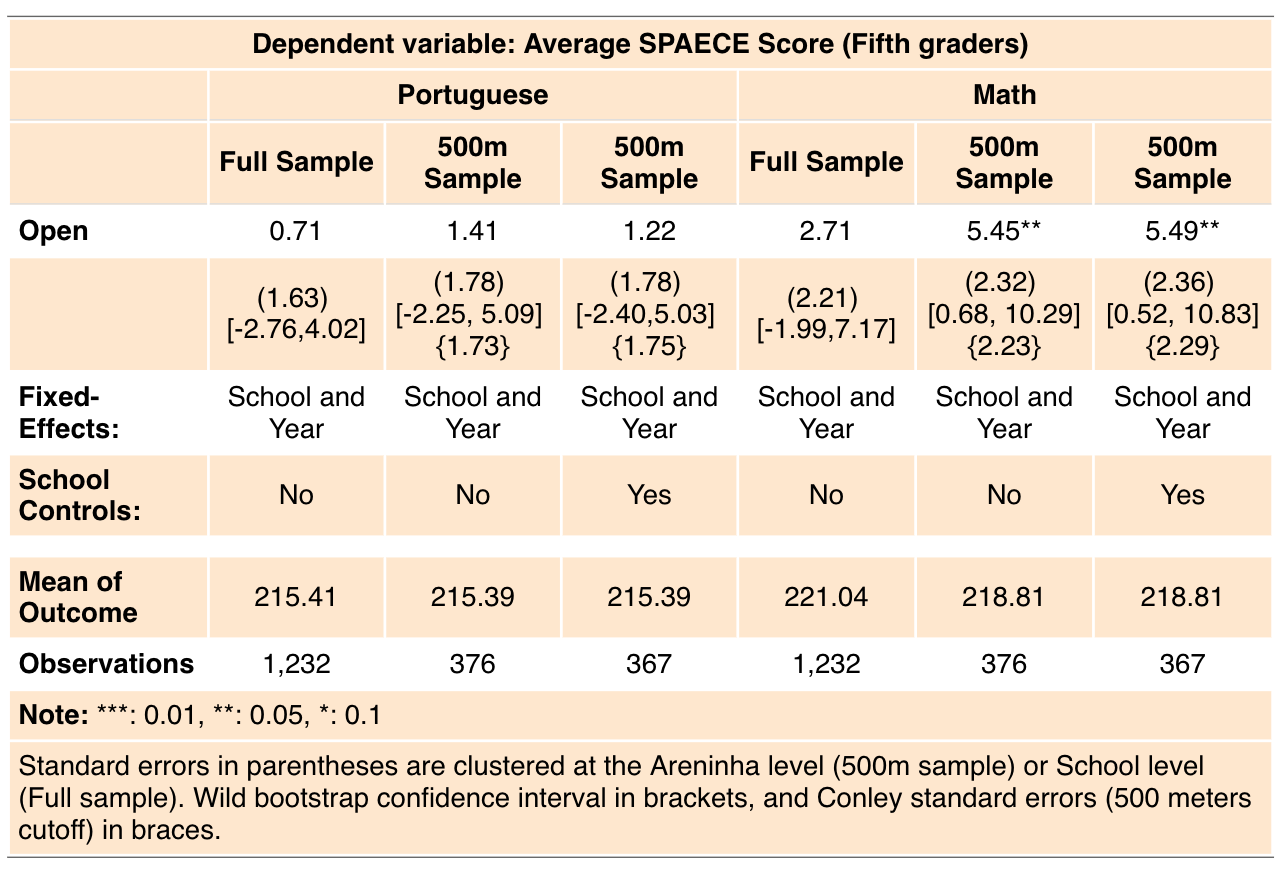
Results School Outcomes
The first three columns display the causal effects of the urban policy on Portuguese scores of students in \(5^{th}\) grade. Results point to an increase of 0.56%, but are not statistically significant
Using the preferred ring size, Math scores increase by 2.5% on average
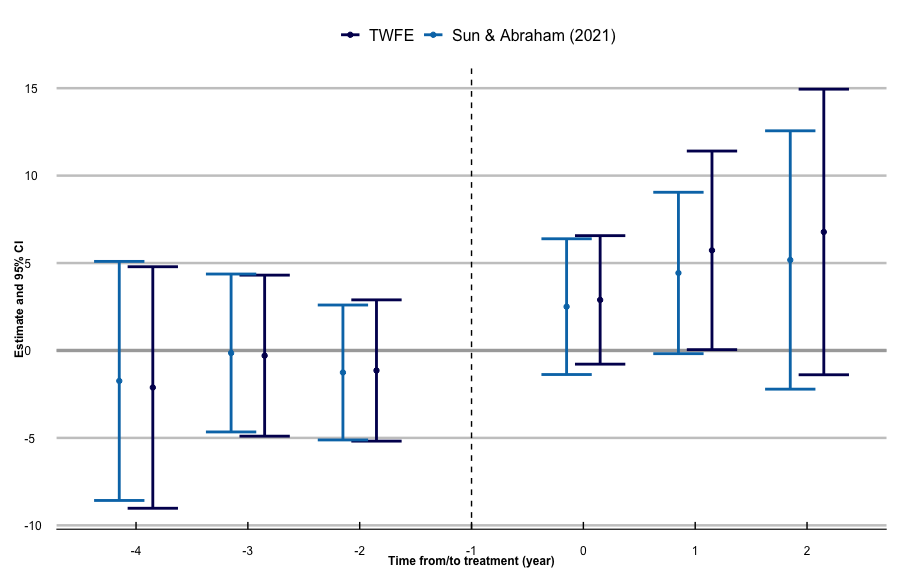
Dynamic treatment effects are estimated by
\[\small\text{y}_{st}=\lambda_{t}+\gamma_{s}+\sum_{\tau=-4, \tau \neq -1}^{2}\beta_{\tau} Open_{st}+\varepsilon_{st}\]
where endpoints are binned at -4 (or less) and 2 (or more). Coefficients are normalized to event time -1
As time passes, the effect appears to increase, although estimates in the third year or more are noisy
As the radius increases, point estimates get smaller
At such small range, inference suffers from few treated clusters, and confidence intervals are made using wild bootstrap